CRCLR Zone Management – Designing the app interface where farmers can monitor the status of their growing system and identify critical issues within their zones before the overall yield of their plants is compromised.
Highlights
Zone Management Features
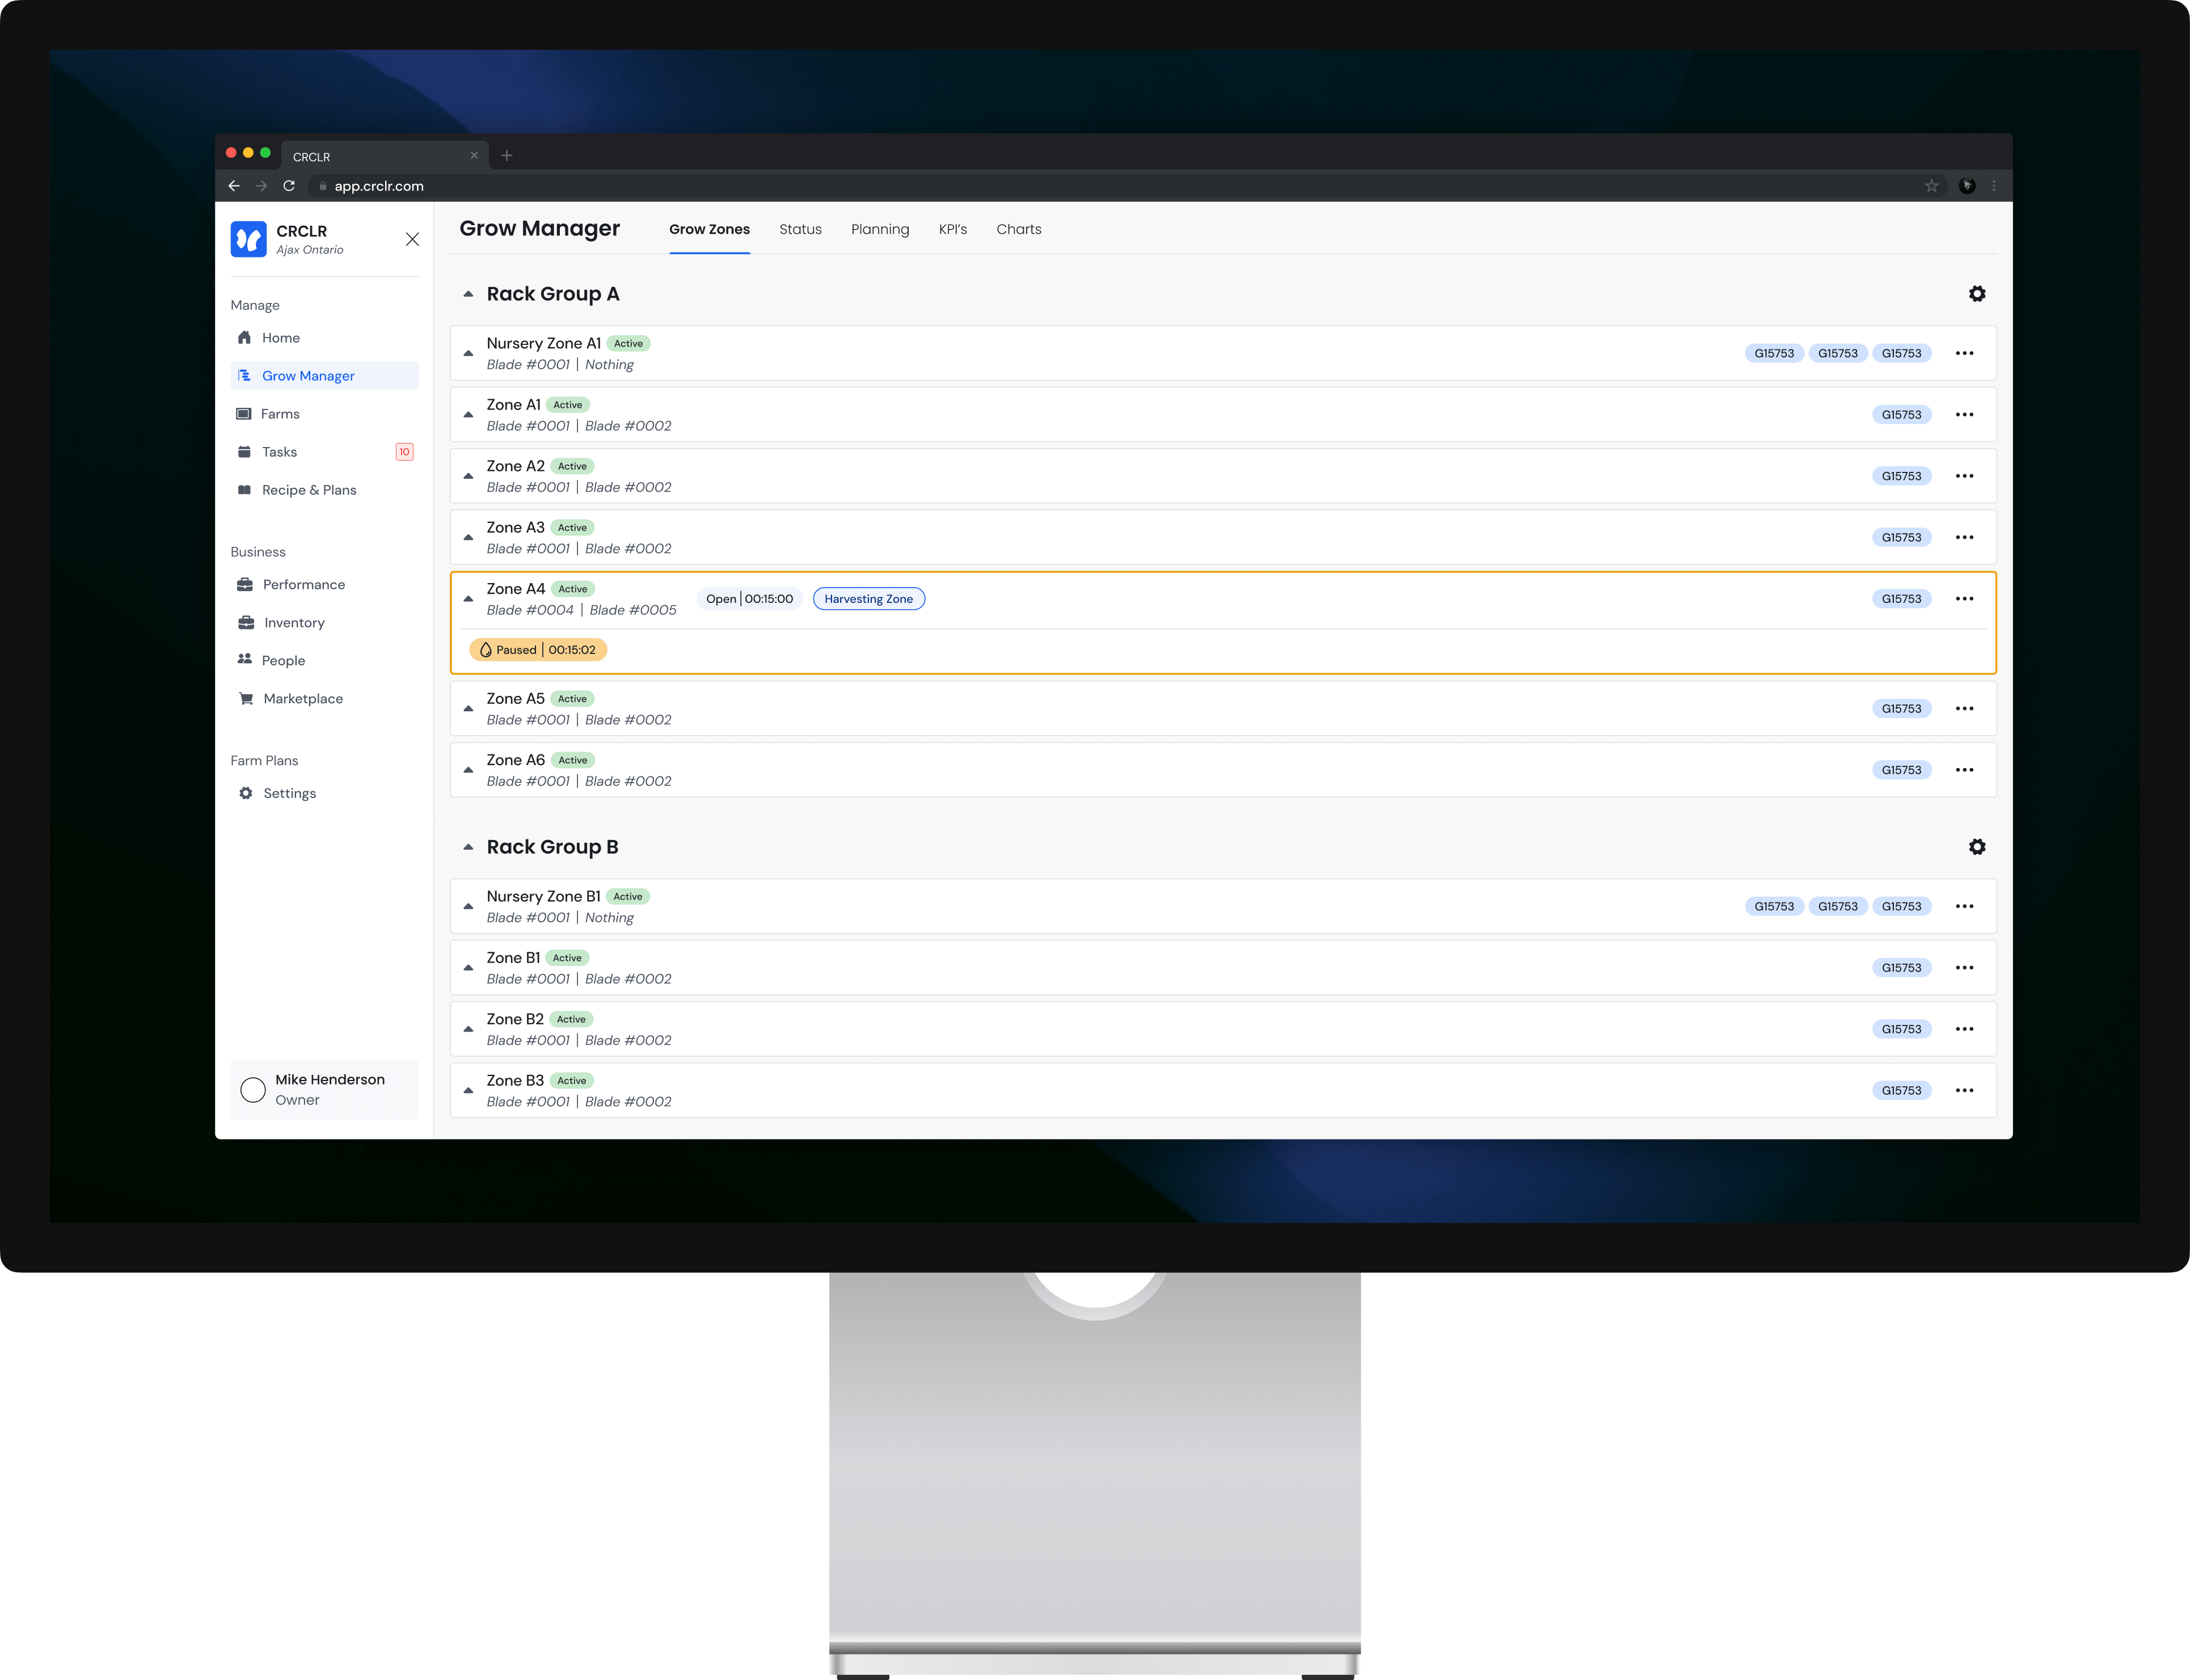
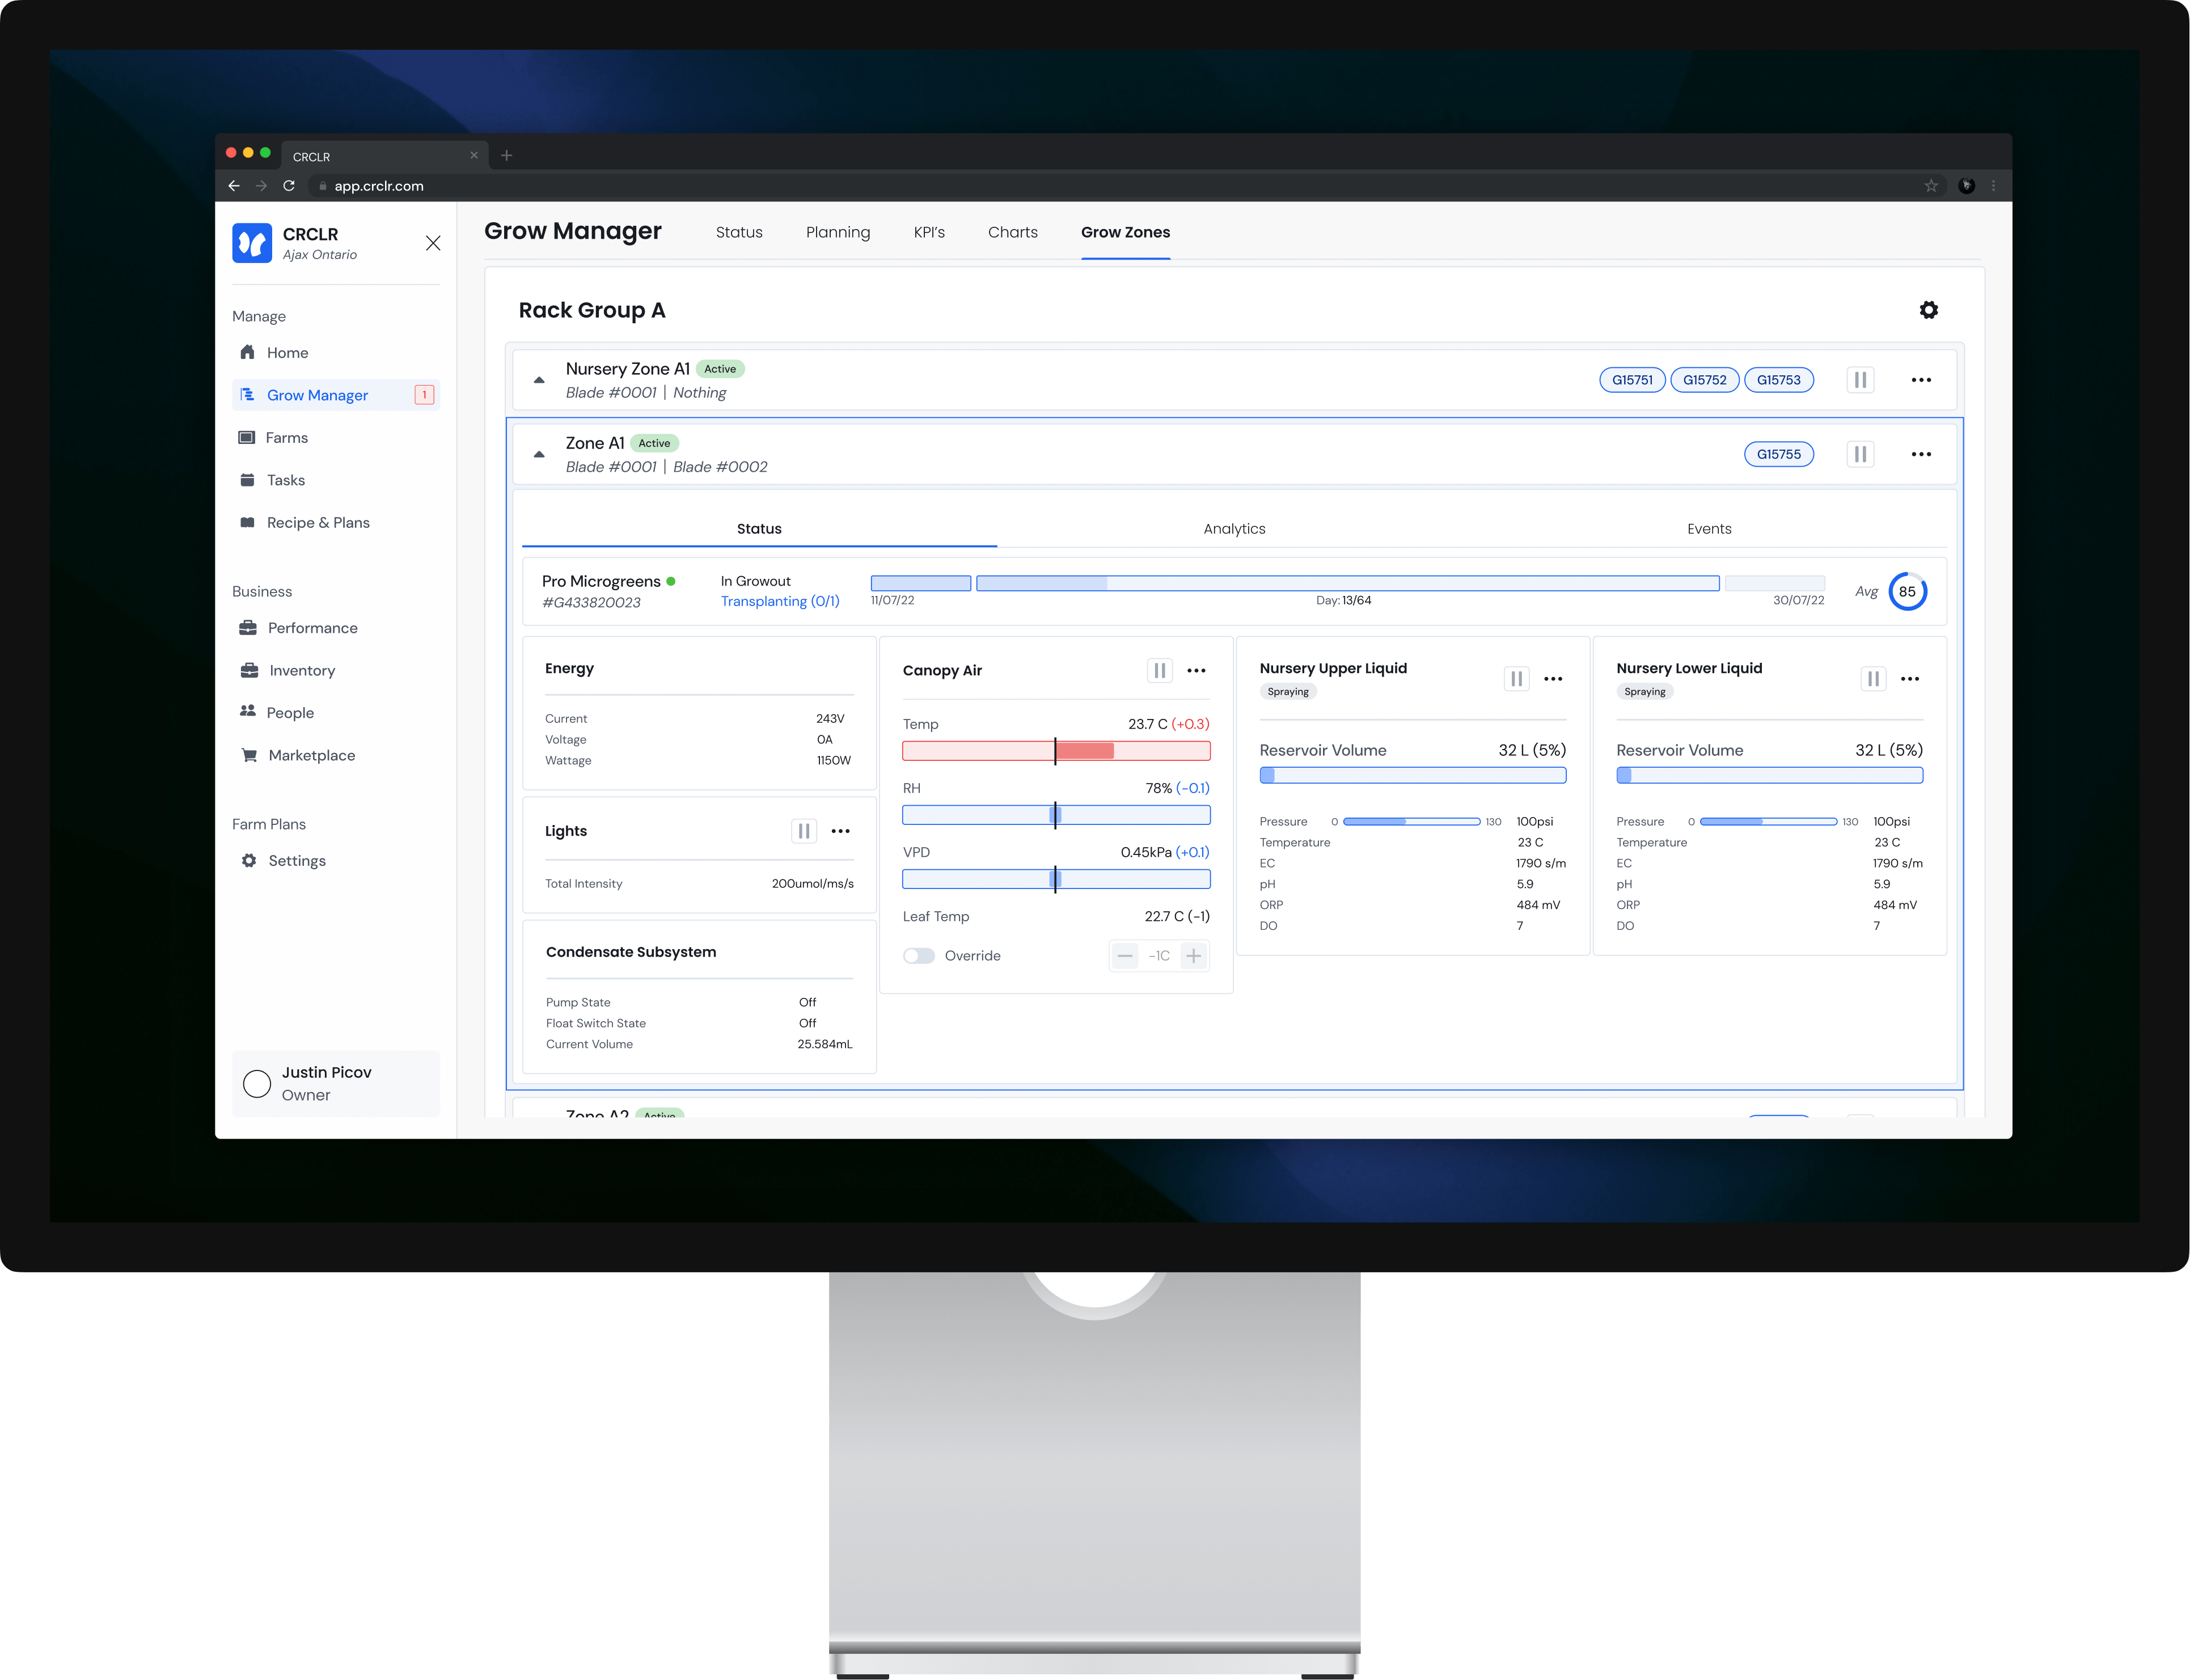
The zone management page give users key info as to their farms activity at a glance. Both colours & text inform the users of zone activity, issues, active grows & more.
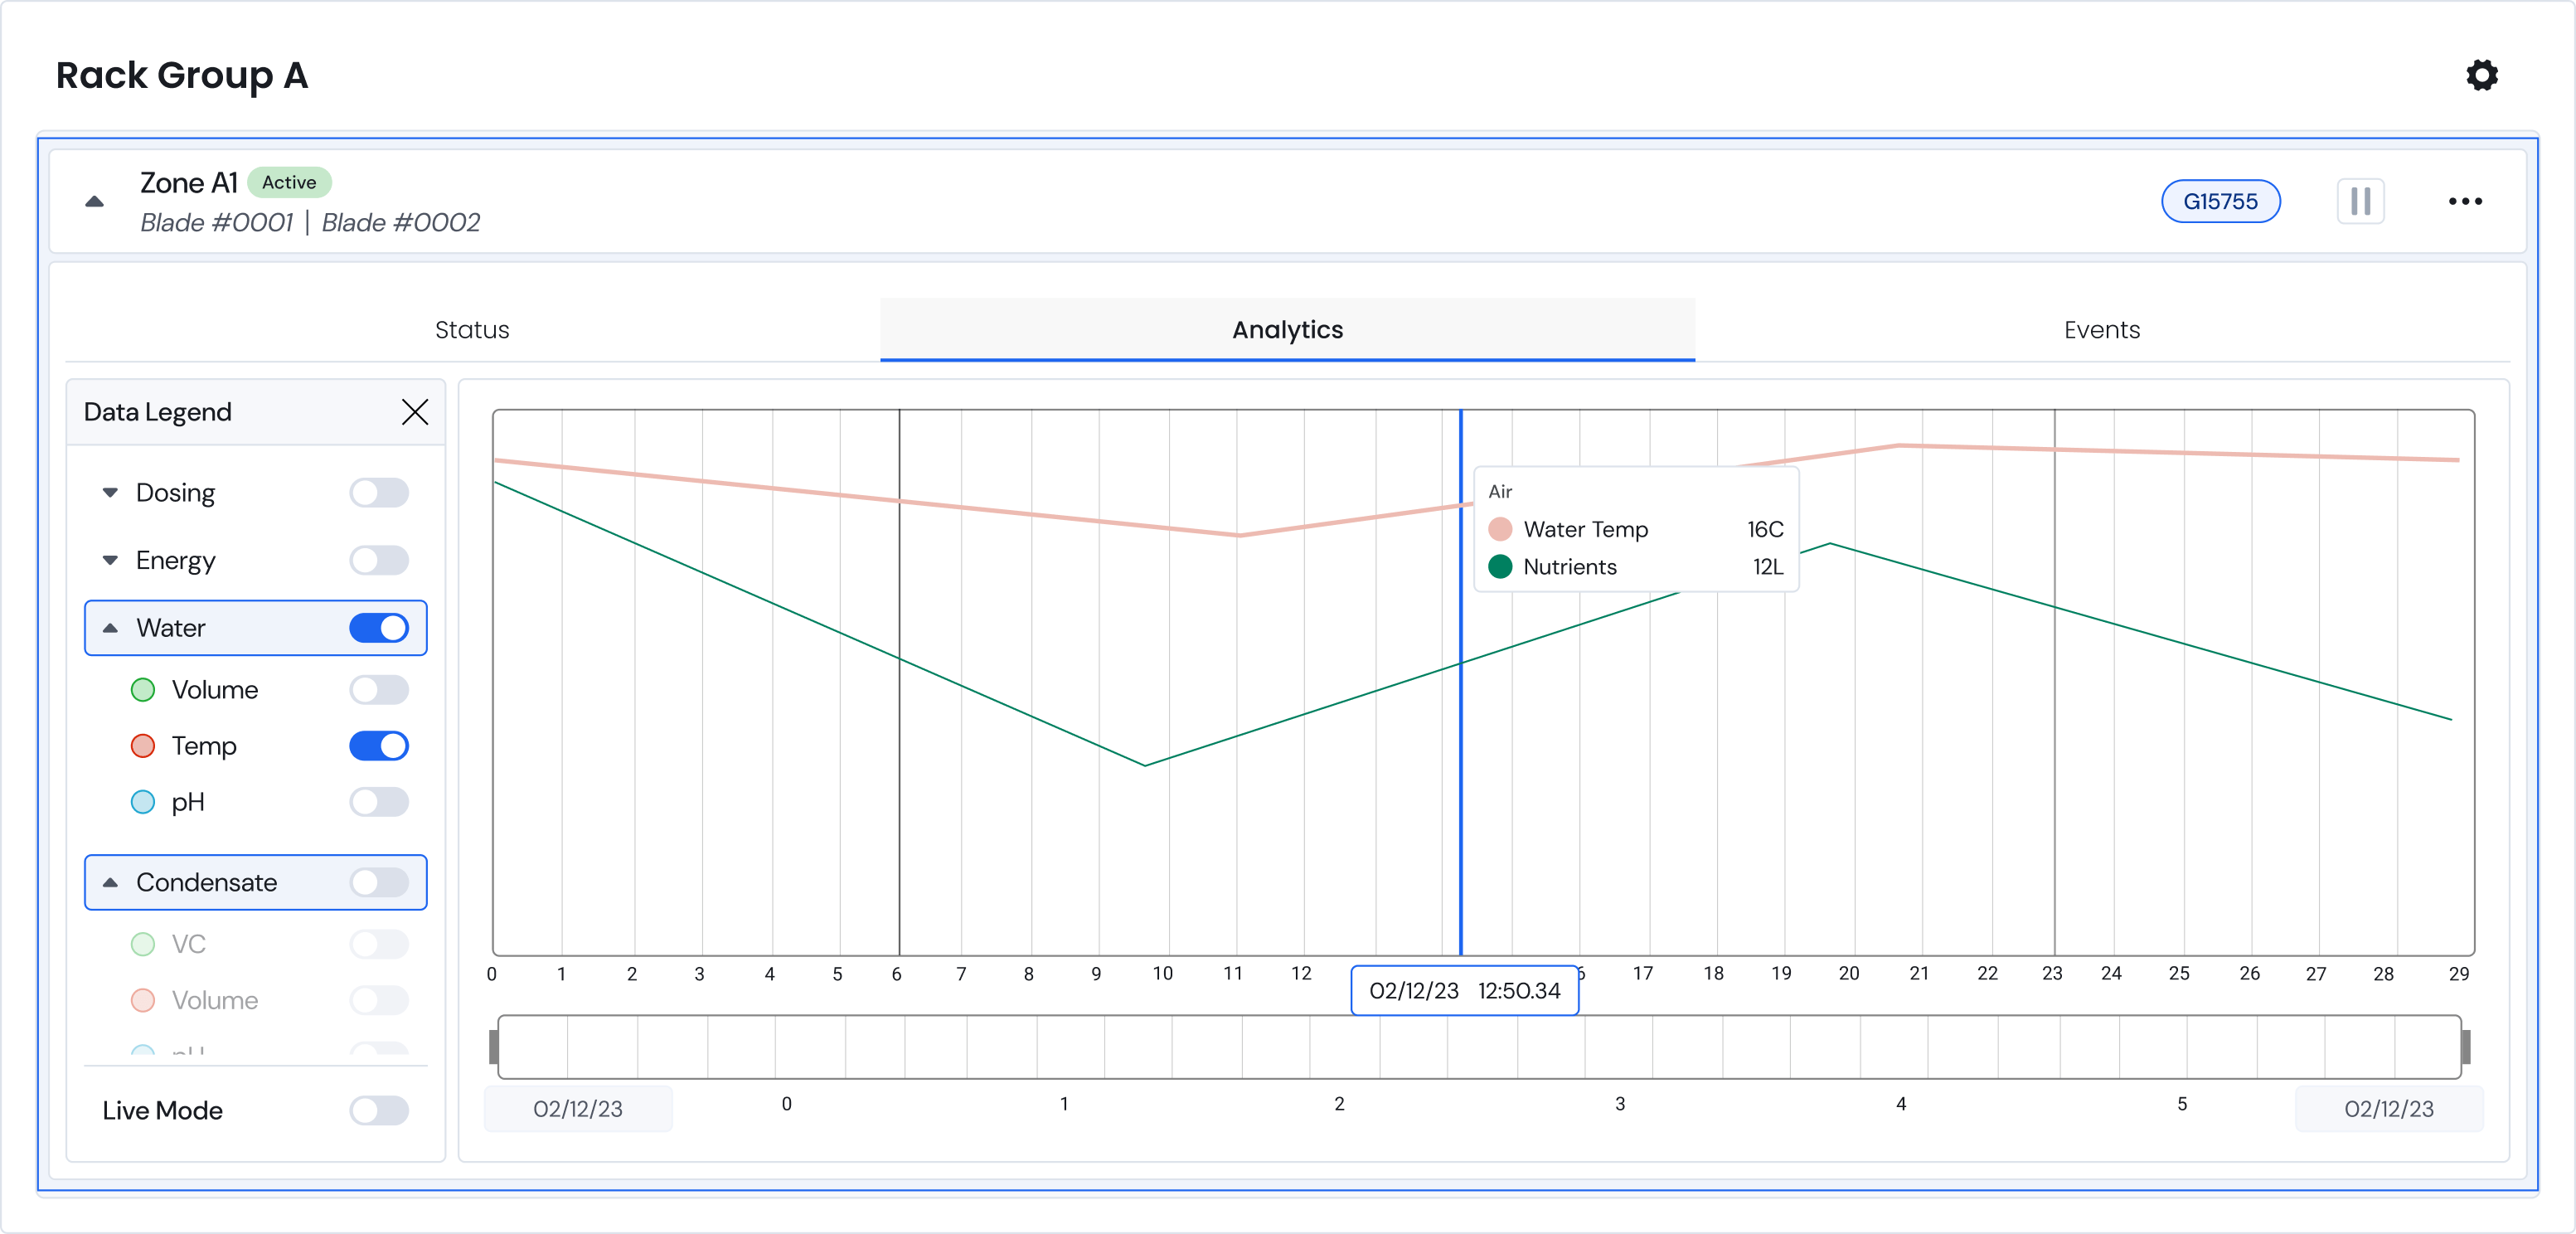
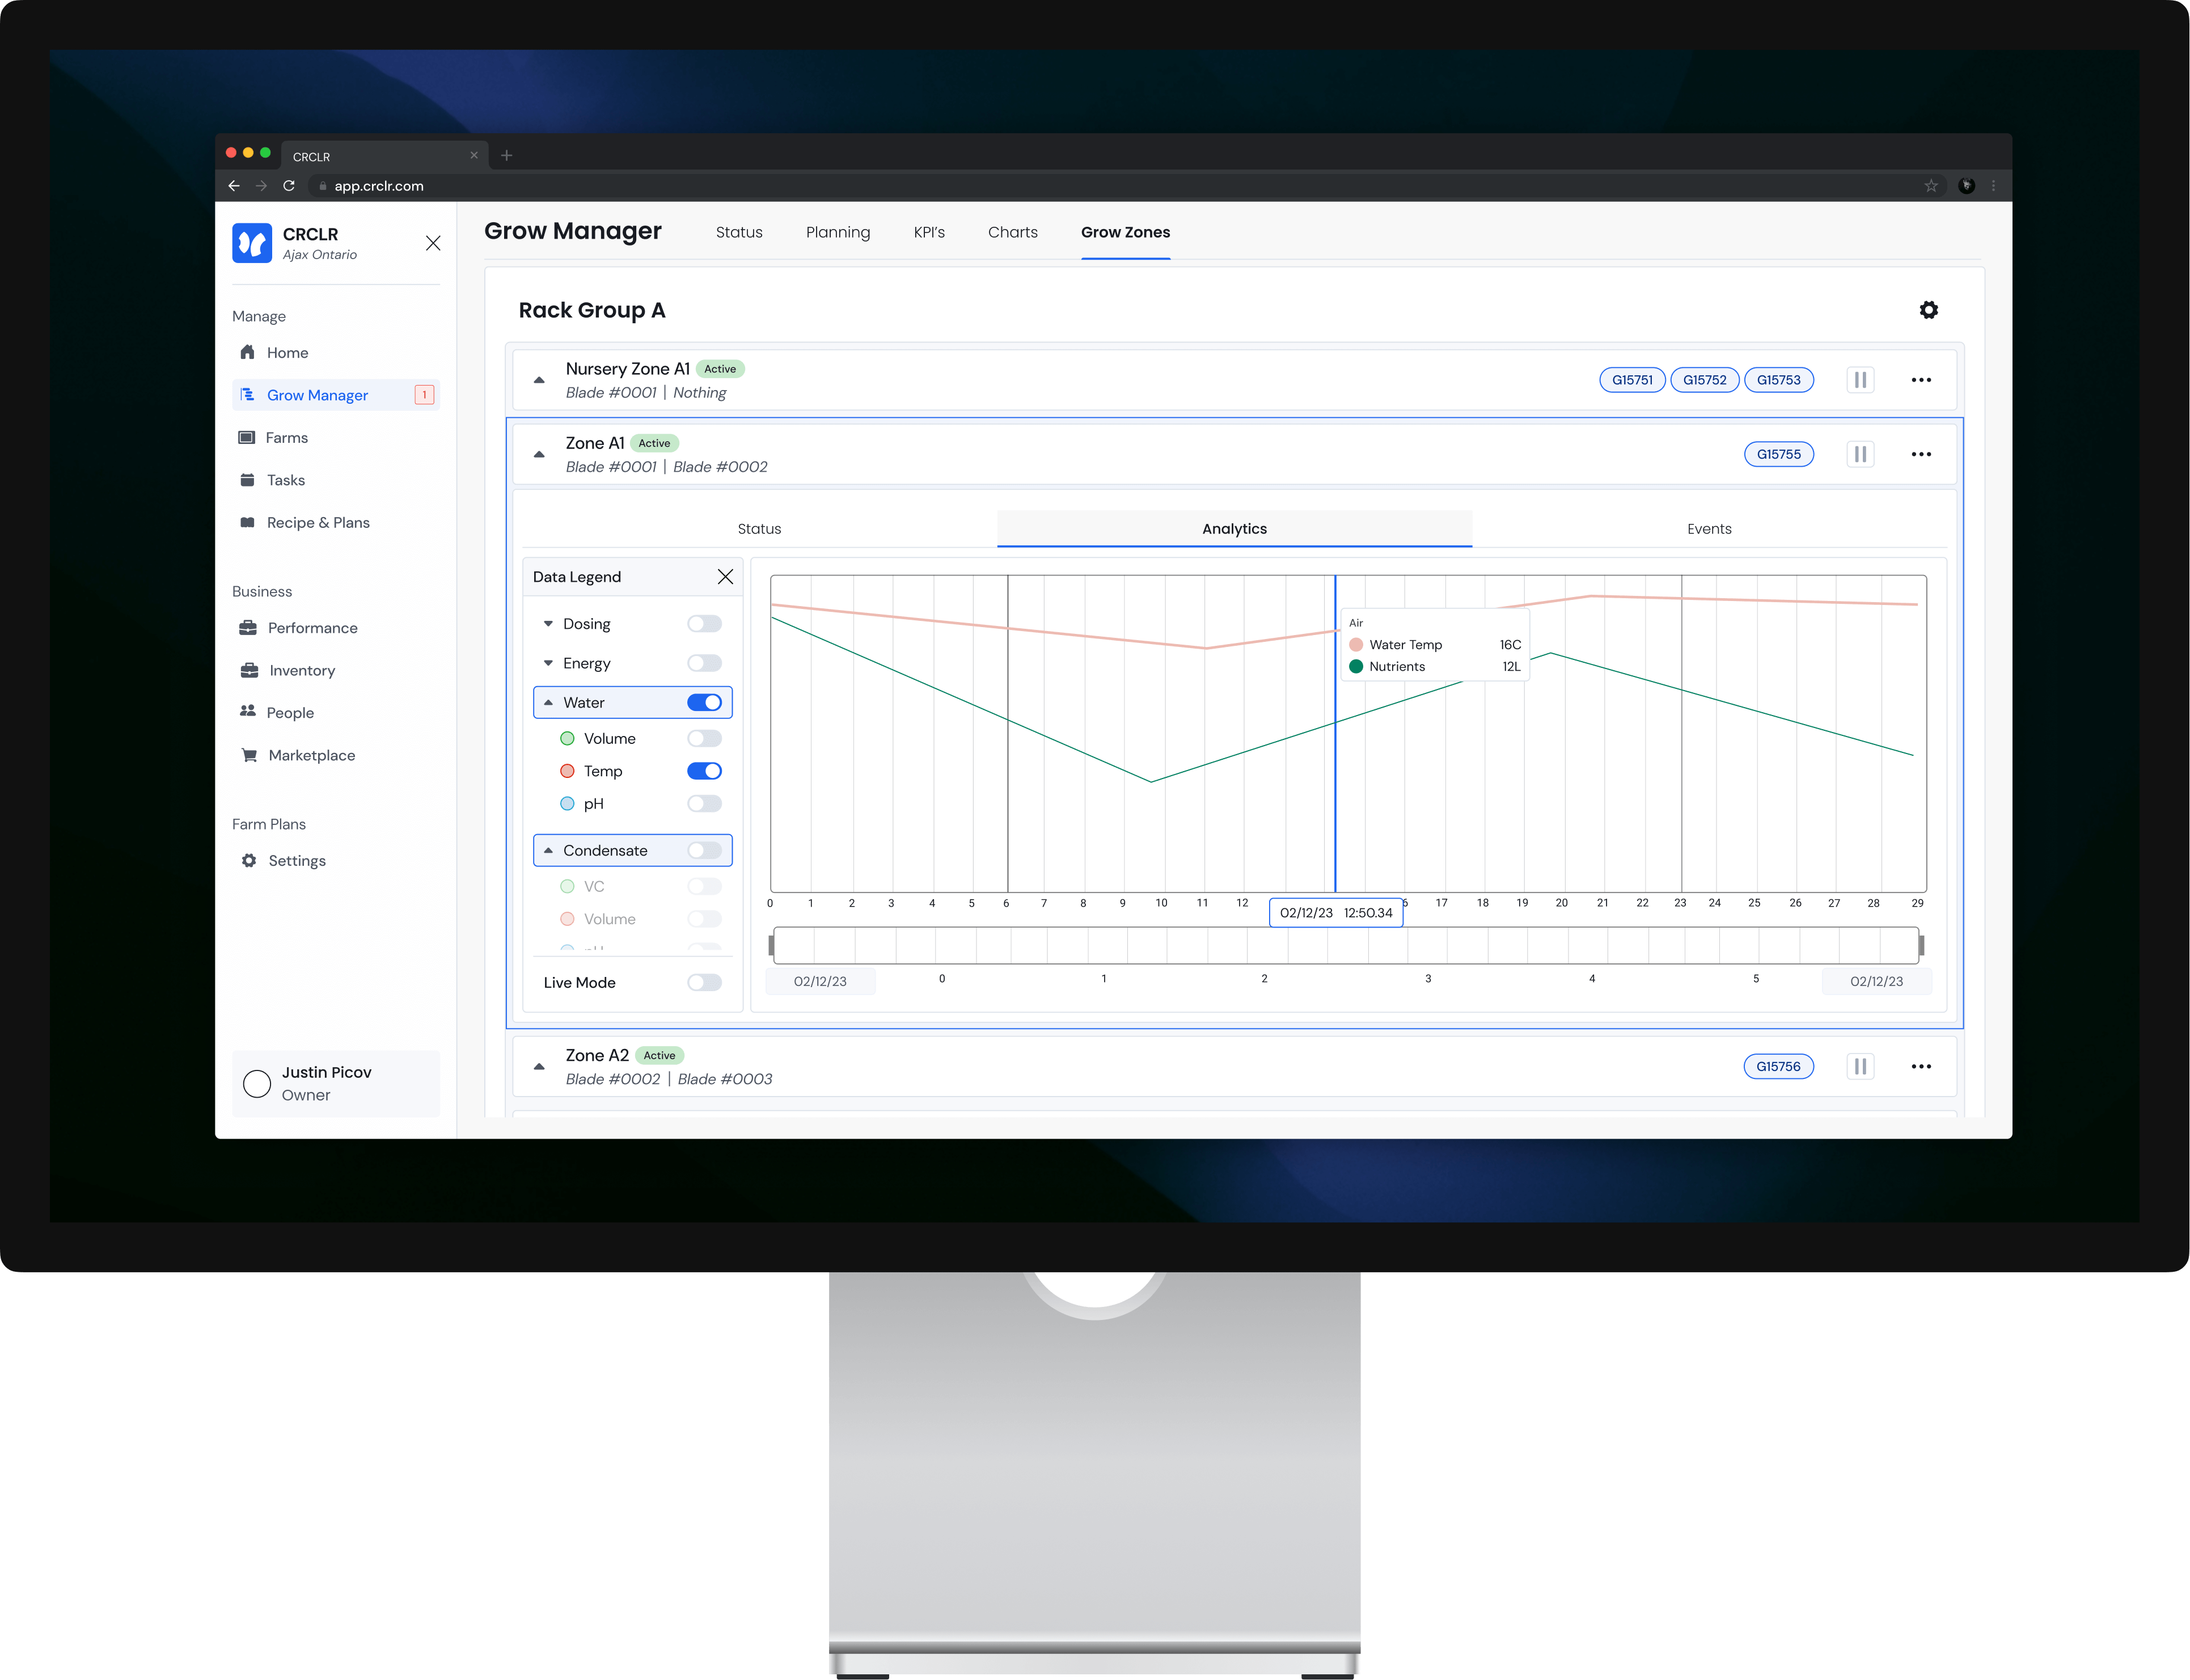
Opening a cell reveals a deeper dive into the zone’s active progress. The analytics page, as shown, provides historical data of the zone’s performance allowing users to identify & troubleshoot issues.
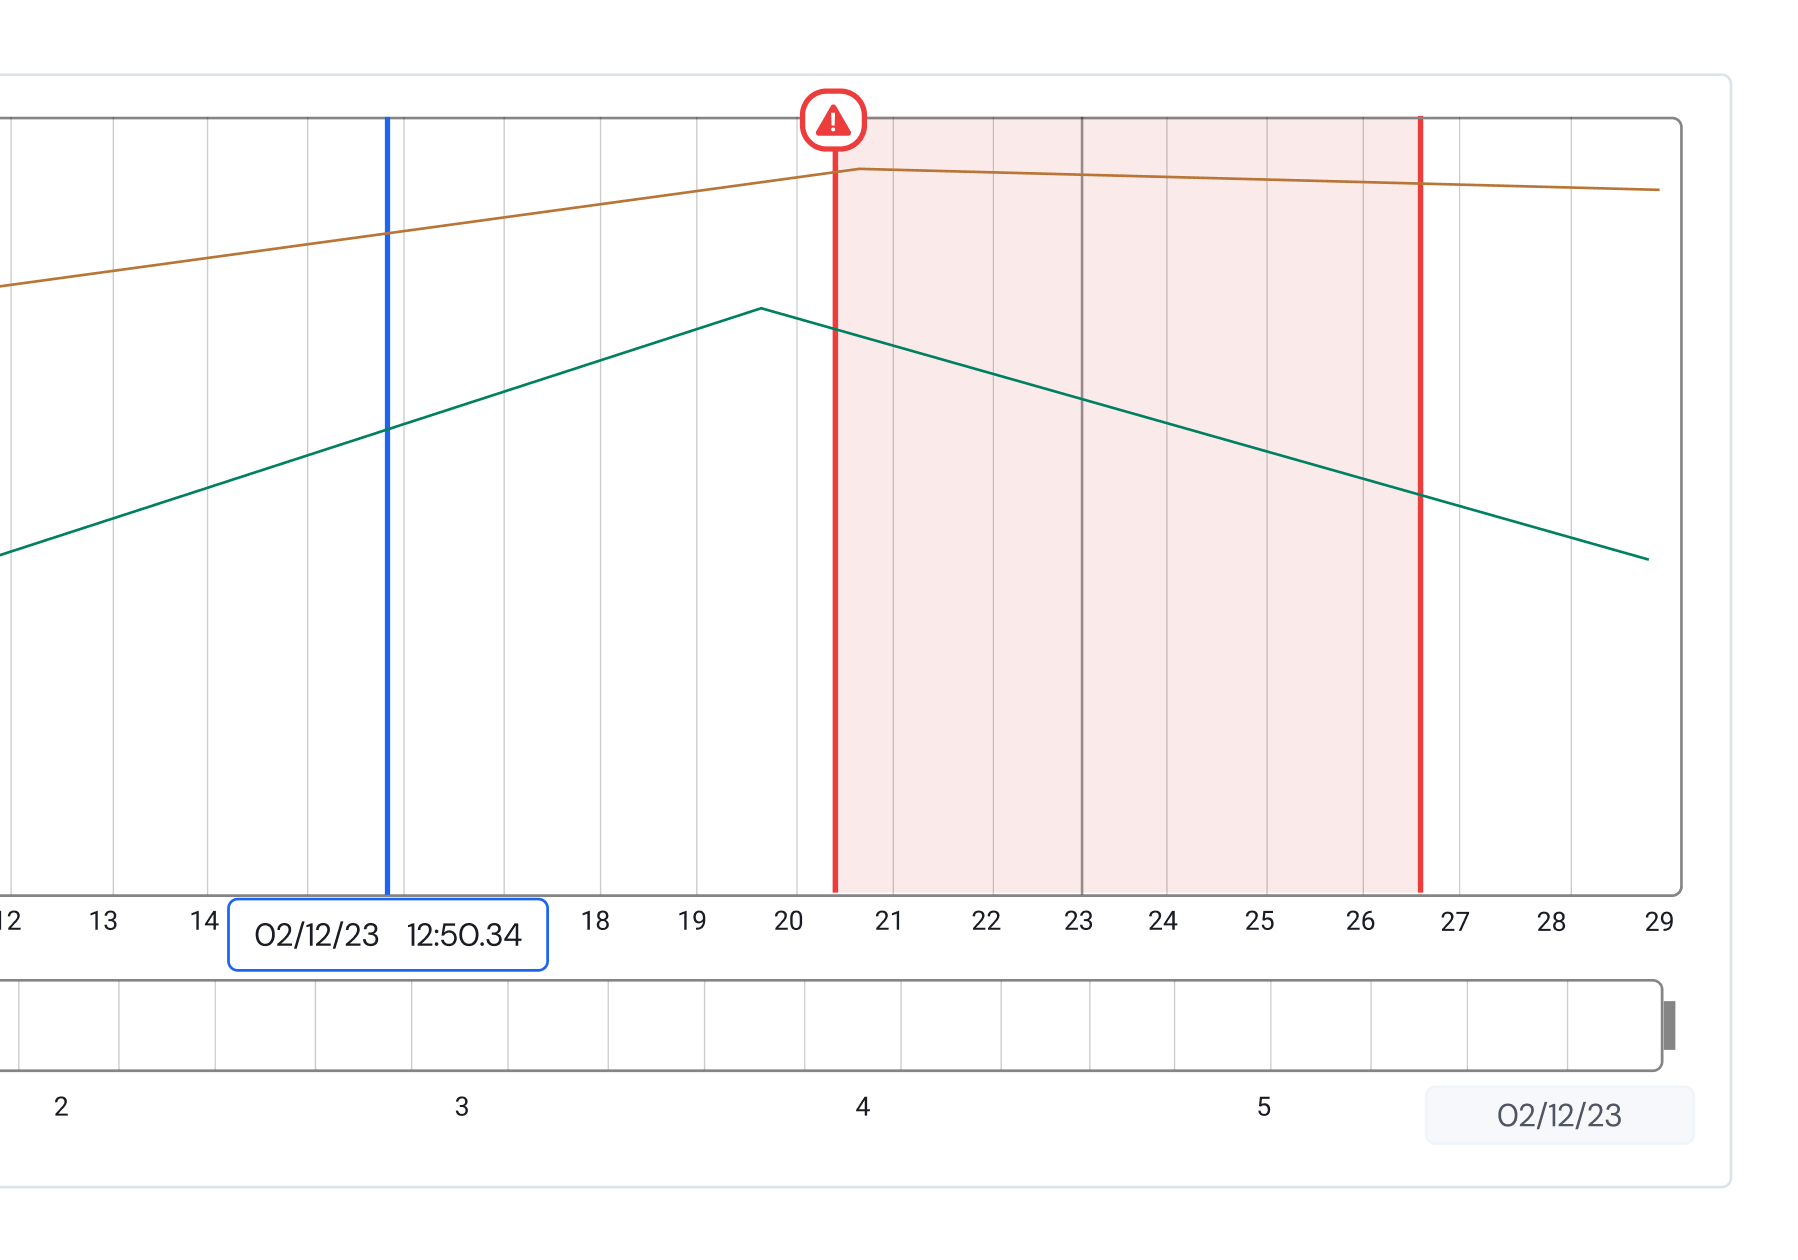
The analytics offer clear clickable call outs for detected down time. Allowing issues to be identified quickly & be accessed on any type of device.
For more info on live performance, the zone status page is where they can see how the zone is physically performing compared to the expected instructions.
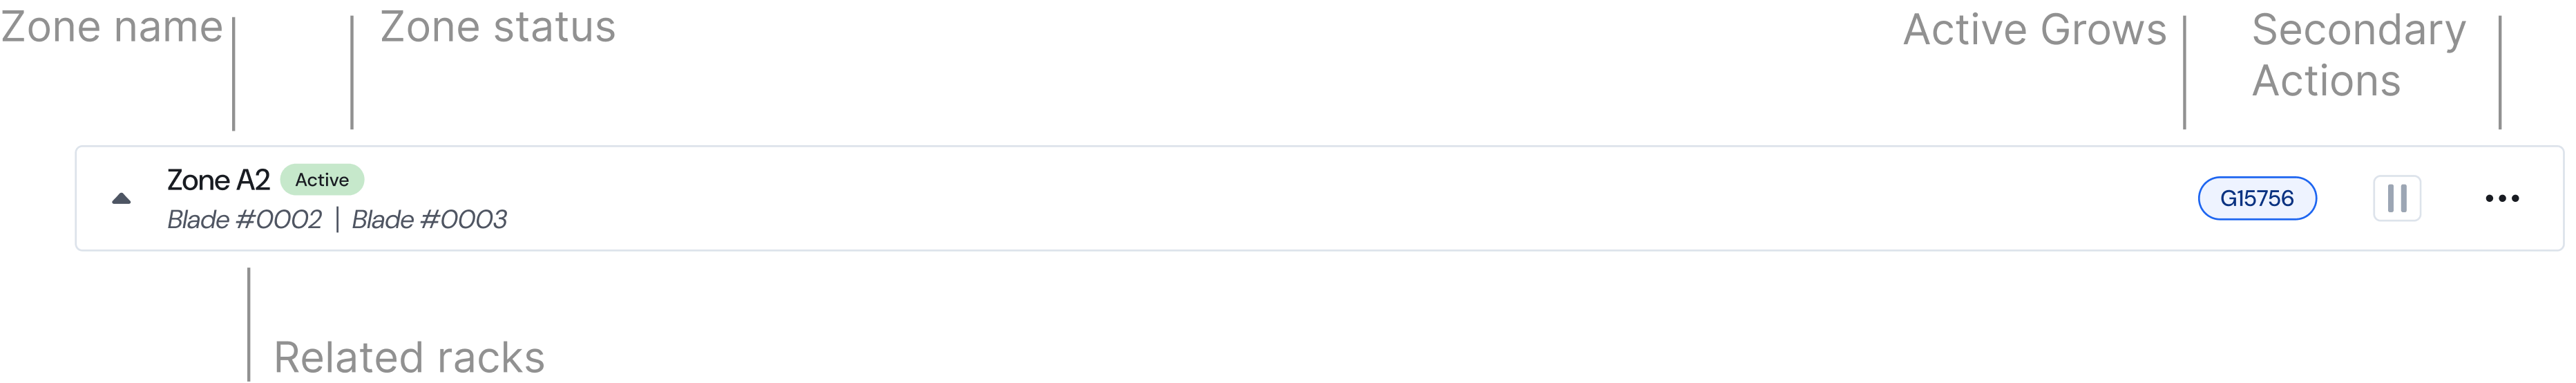
Zone cells
The zone management page give users key info as to their farms activity at a glance. Both colours & text inform the users of zone activity, issues, active grows & more.
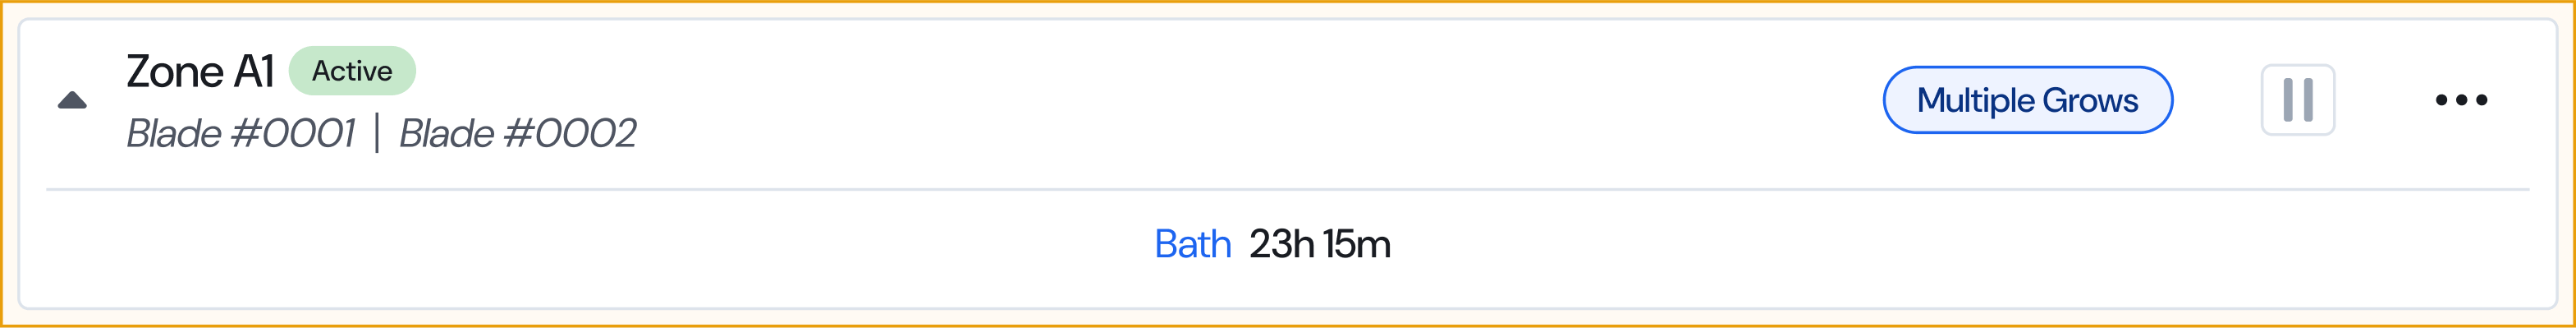
Zone info widgets
For more info on live performance, the zone status page is where they can see how the zone is physically performing compared to the expected instructions.
Down time detection
The analytics offer clear clickable call outs for detected down time. Allowing issues to be identified quickly & be accessed on any type of device.
Analytics
Opening a cell reveals a deeper dive into the zone’s active progress. The analytics page, as shown, provides historical data of the zone’s performance allowing users to identify & troubleshoot issues.
Background
Company Info
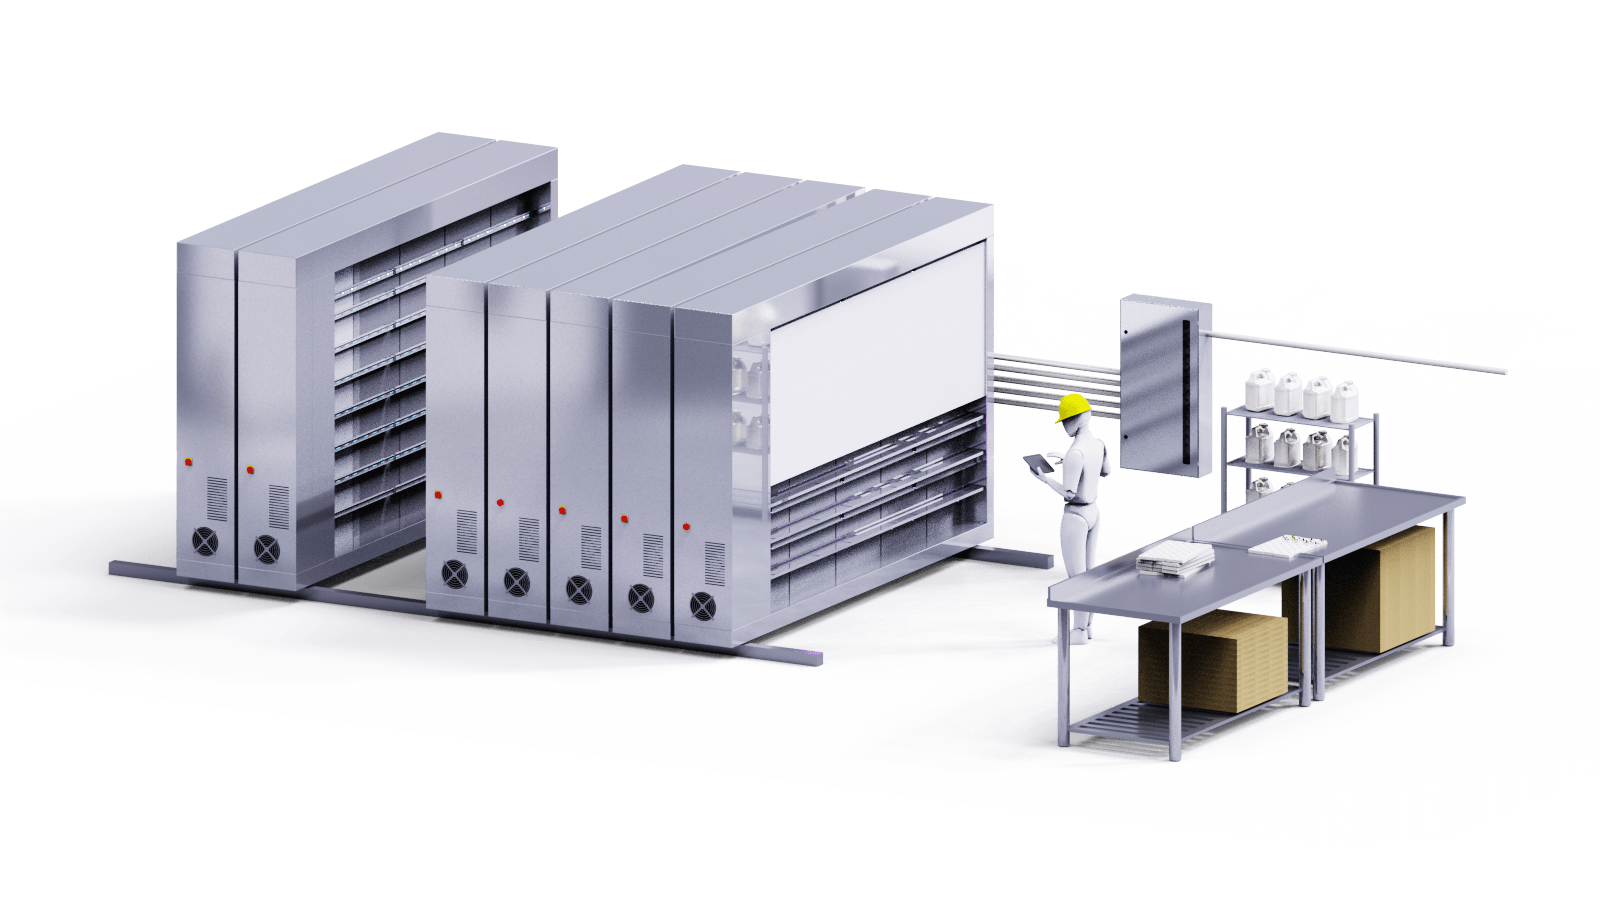
The CRCLR system is a series of movable racks, a nutrient distribution system and a software that allows users to manage indoor farms. These farms operate year round controlling all possible environmental variables such as temperature, nutrients, humidity, light levels & more.
Branding: Simple yet powerful
CRCLR as a brand aims to offer capable hardware & software packaged in a very sleek & easy to understand package. Important functions are always easily accessible with more niche specialized options hidden for users willing to dig.
Problem
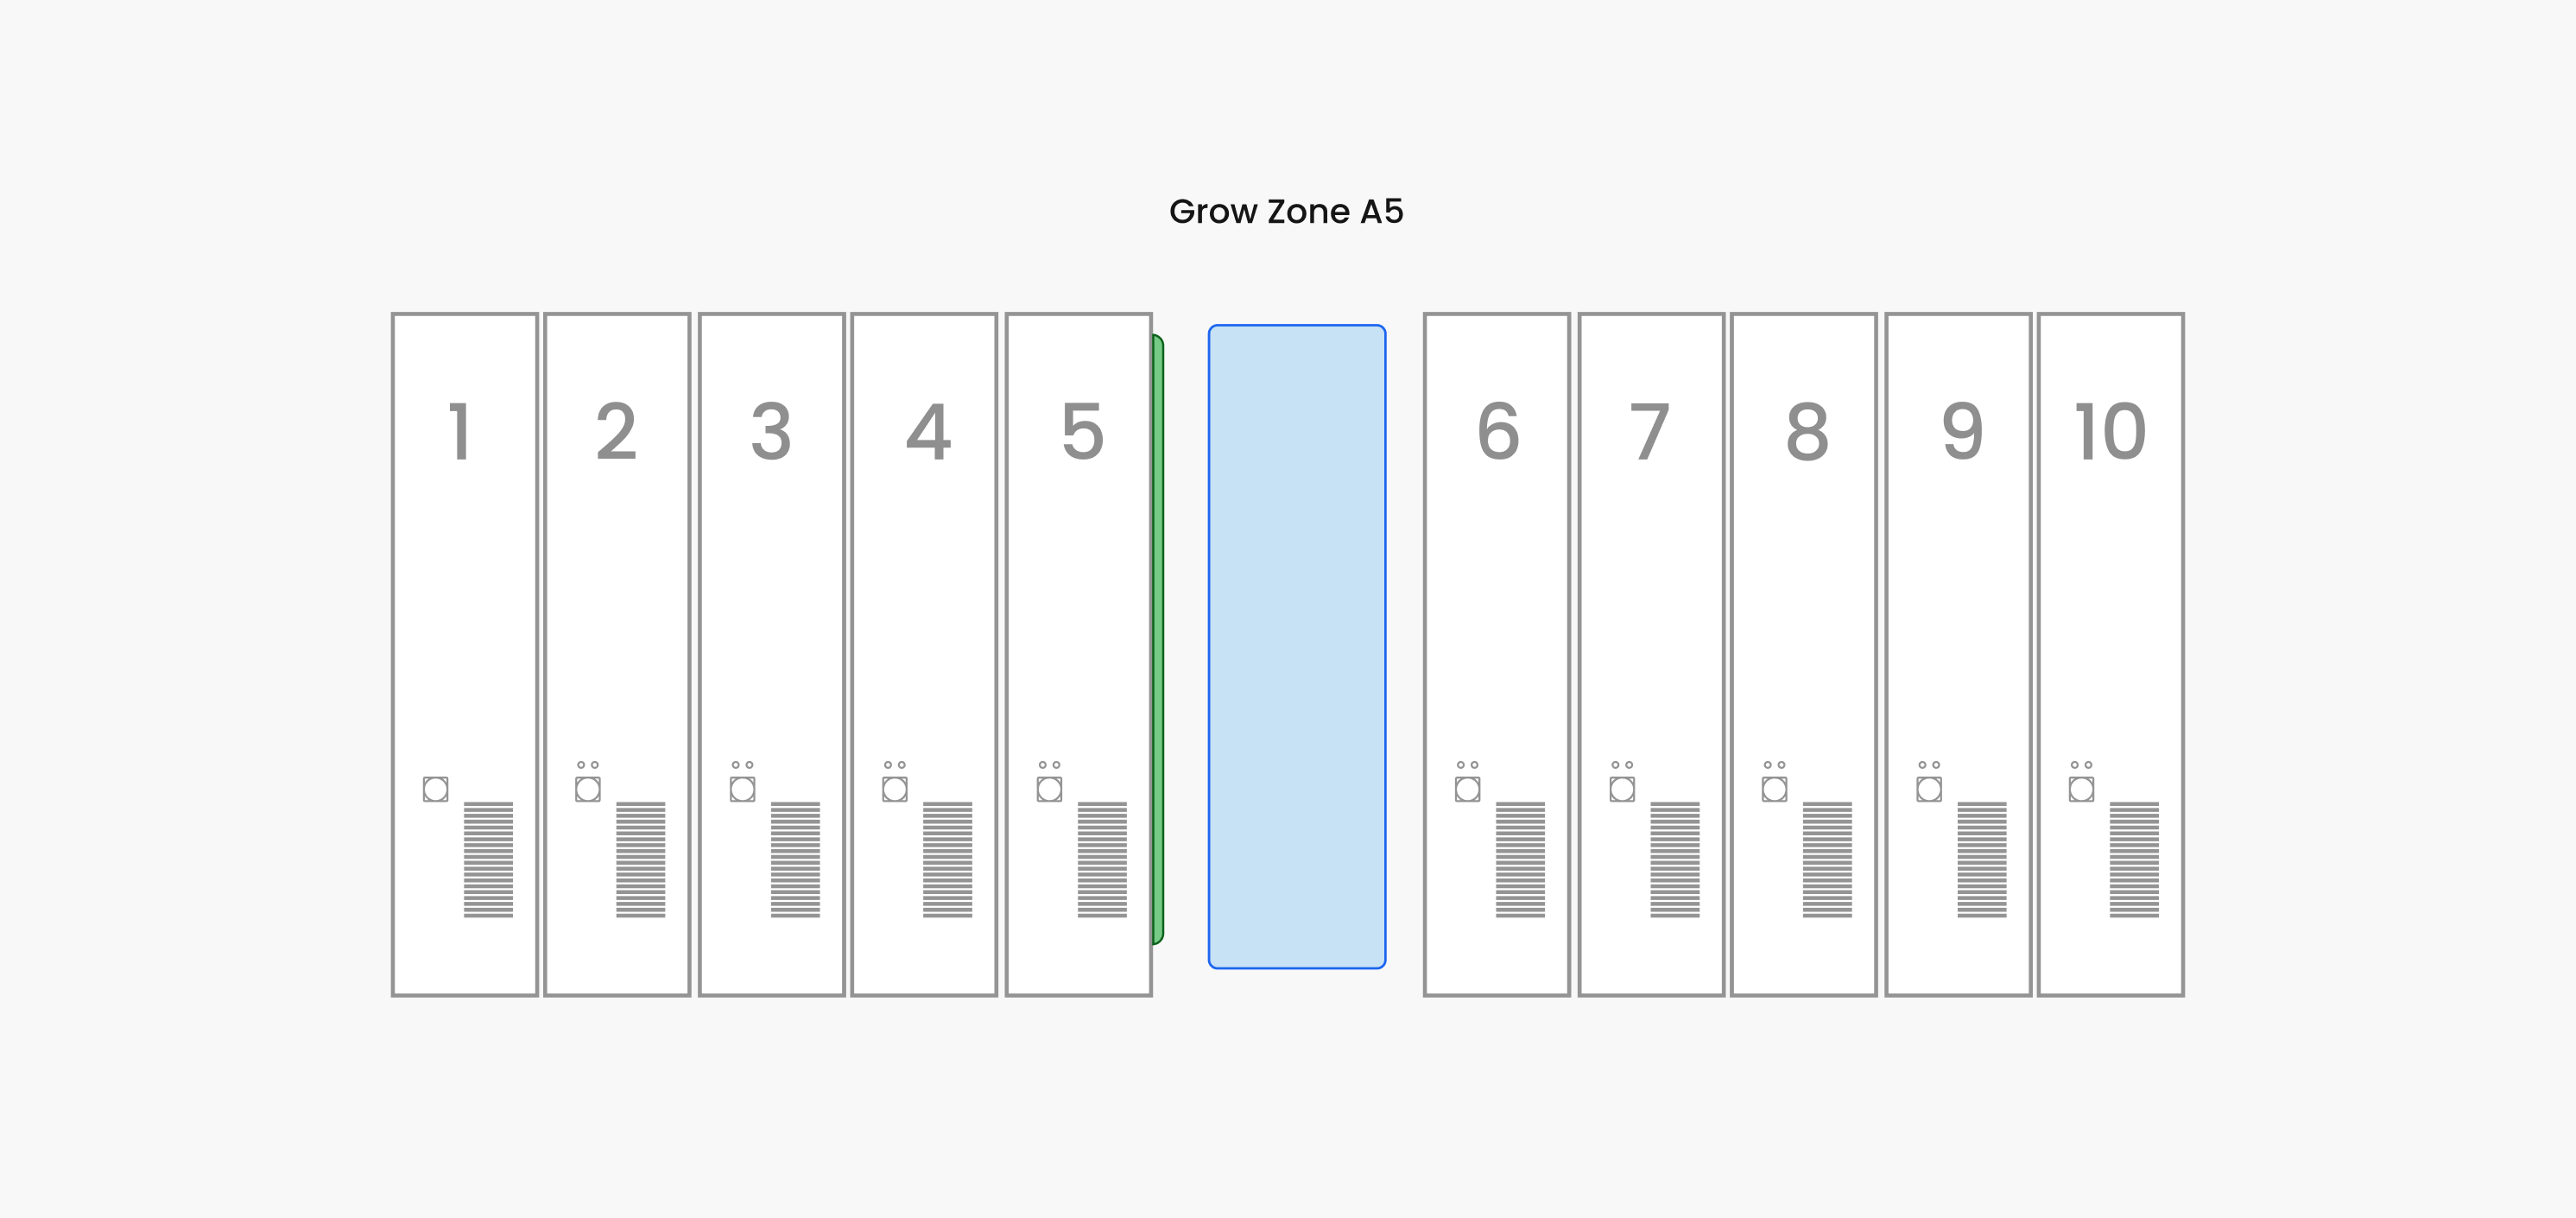
What is a grow zone?
In a CRCLR farm, a grow zone is the space between two racks where plants grow. Users have full control over this space to manage air light & water variables. Within this space farmers can grow anything from greens to berries in ideal pesticide free conditions.
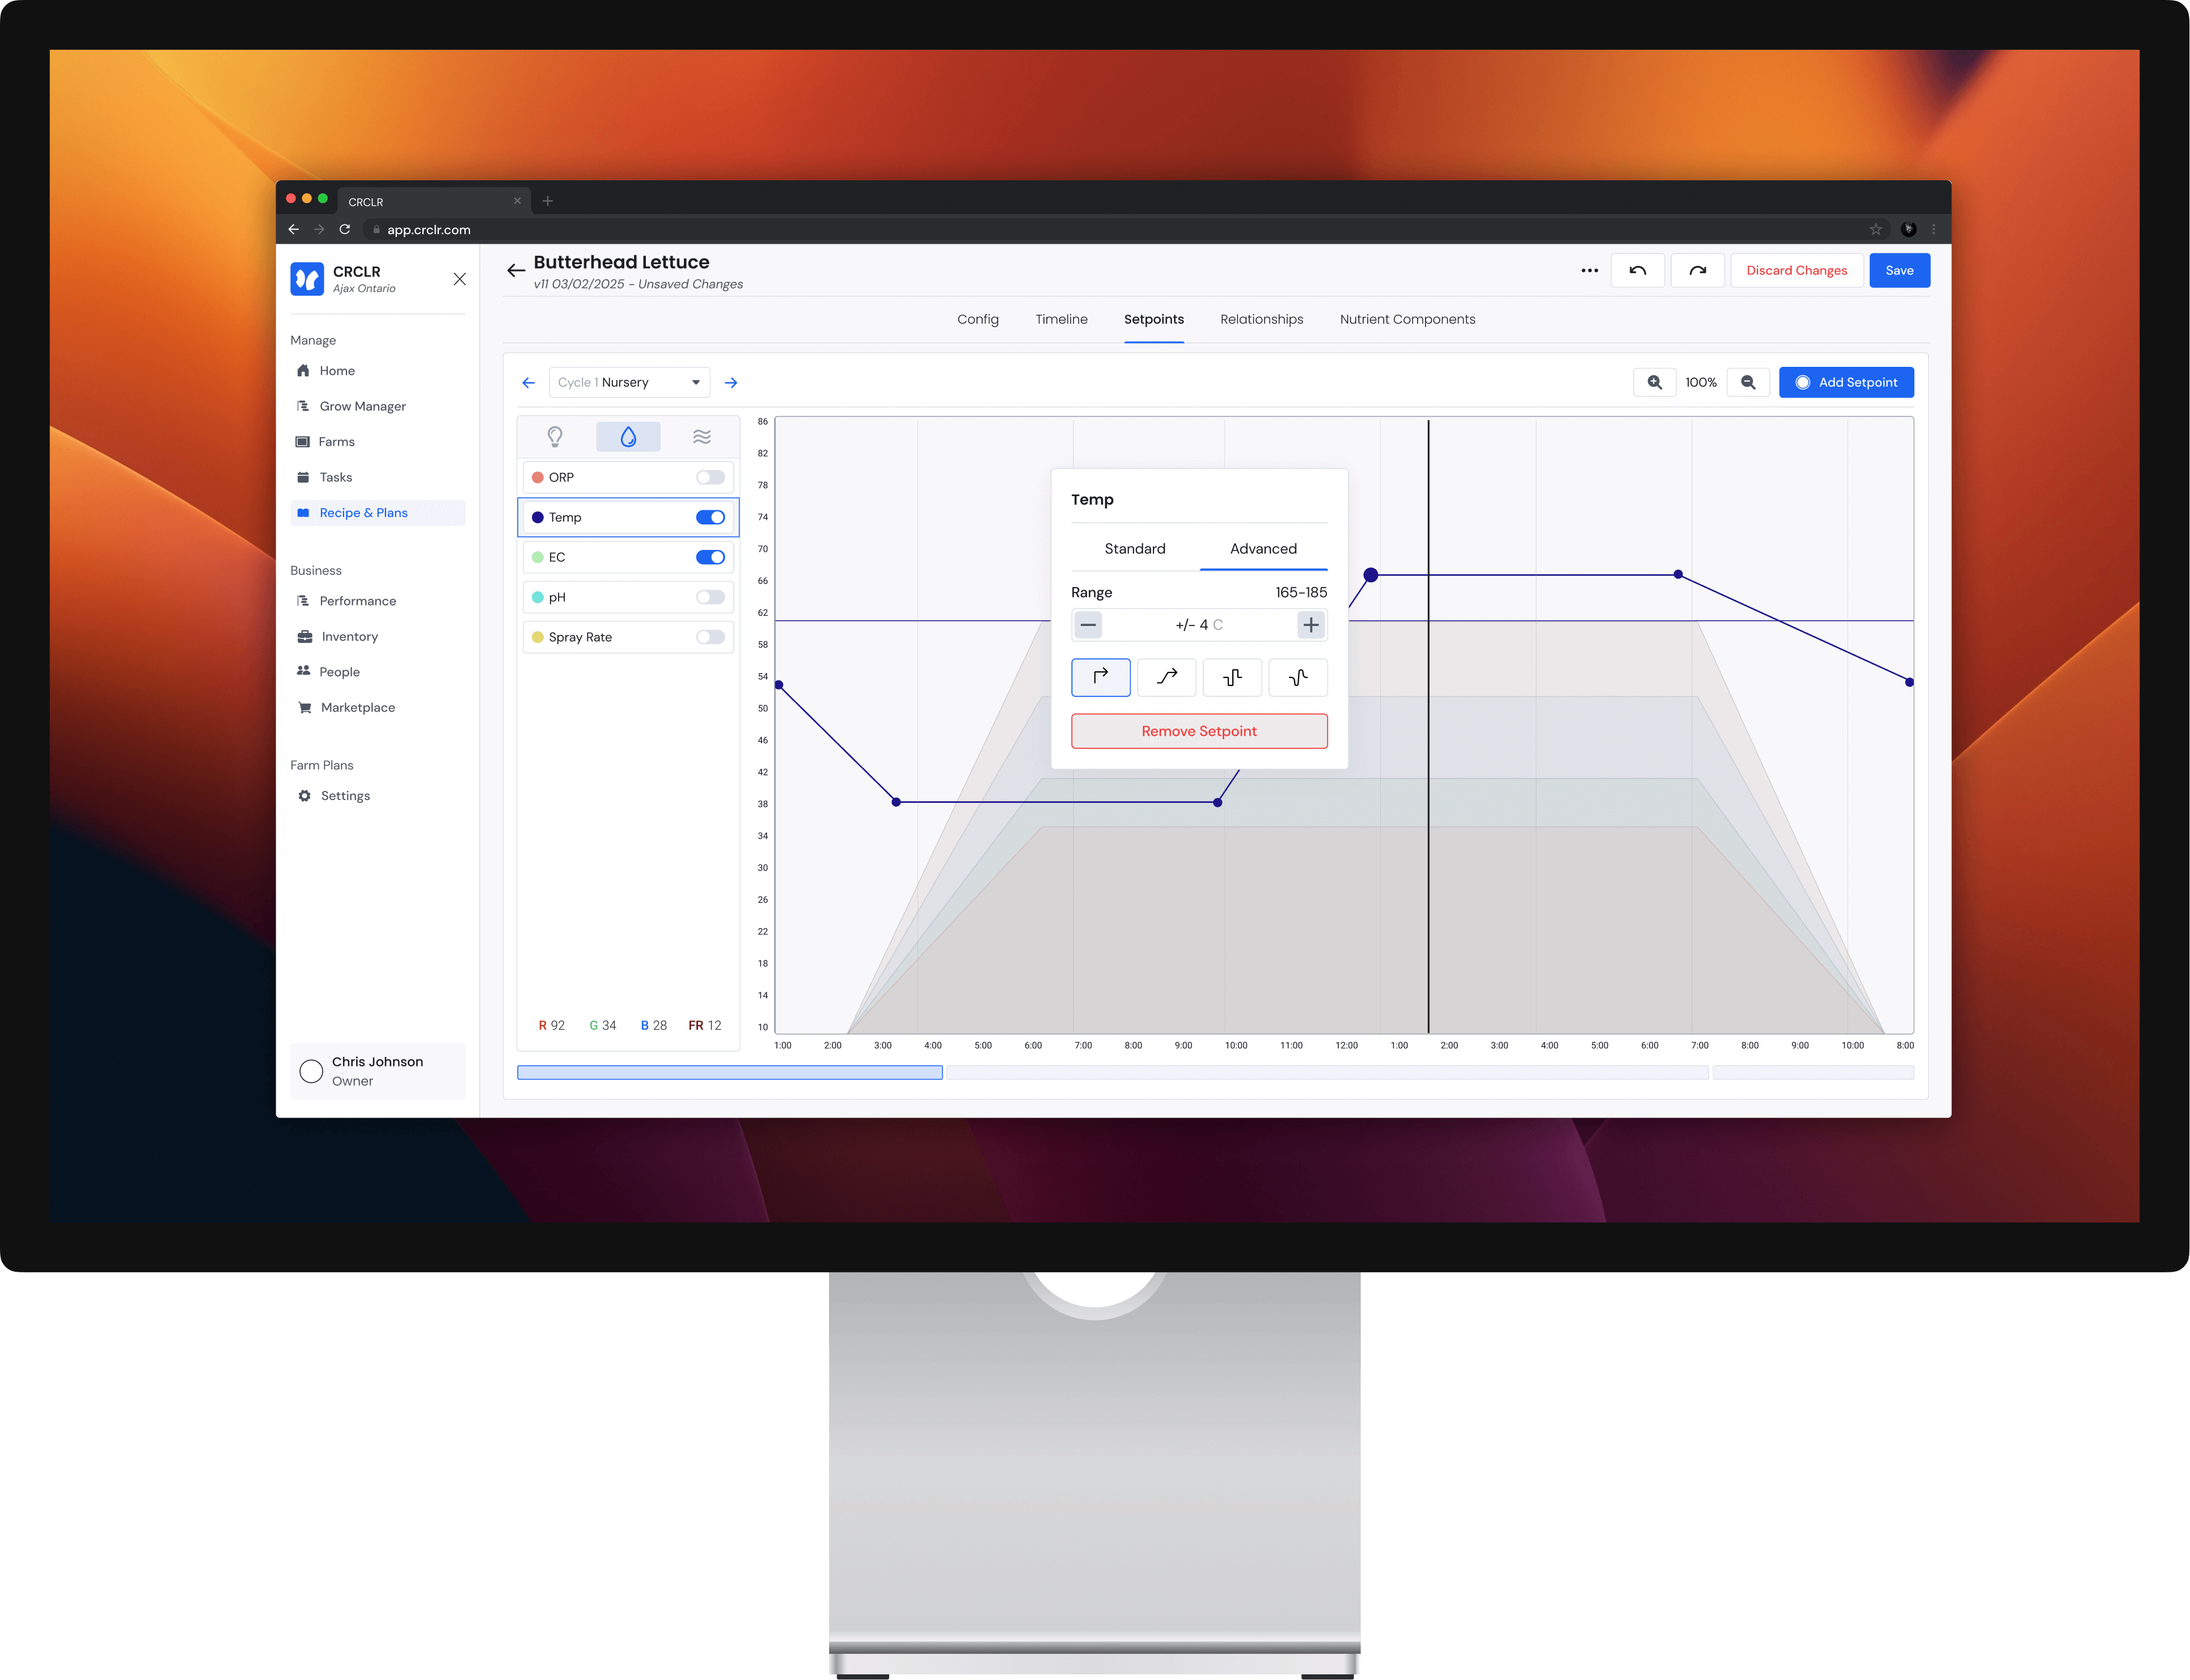
How does it grow plants?
A grow zone grows plants by perfectly managing the environment in the gap between two racks. Users can set a "recipe" which essentially is a set of instruction for how the environment should be set at every stage of the plant's growth.
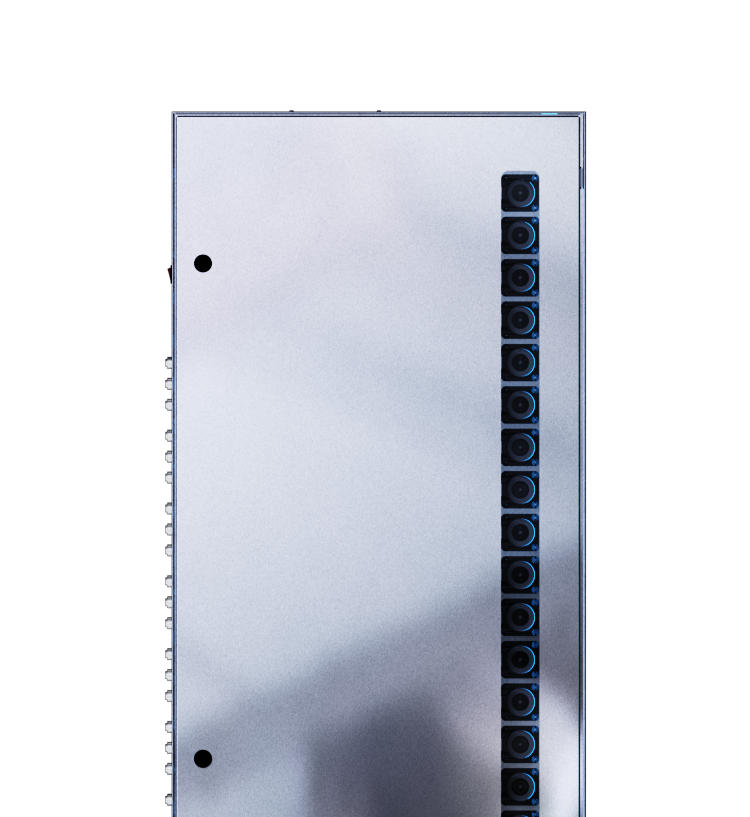
Plant/Water side
On the left side plants grow inside of foam plugs inserted in small holes. The growing roots face nozzles tha spry the roots directly with water dose with nutrients.
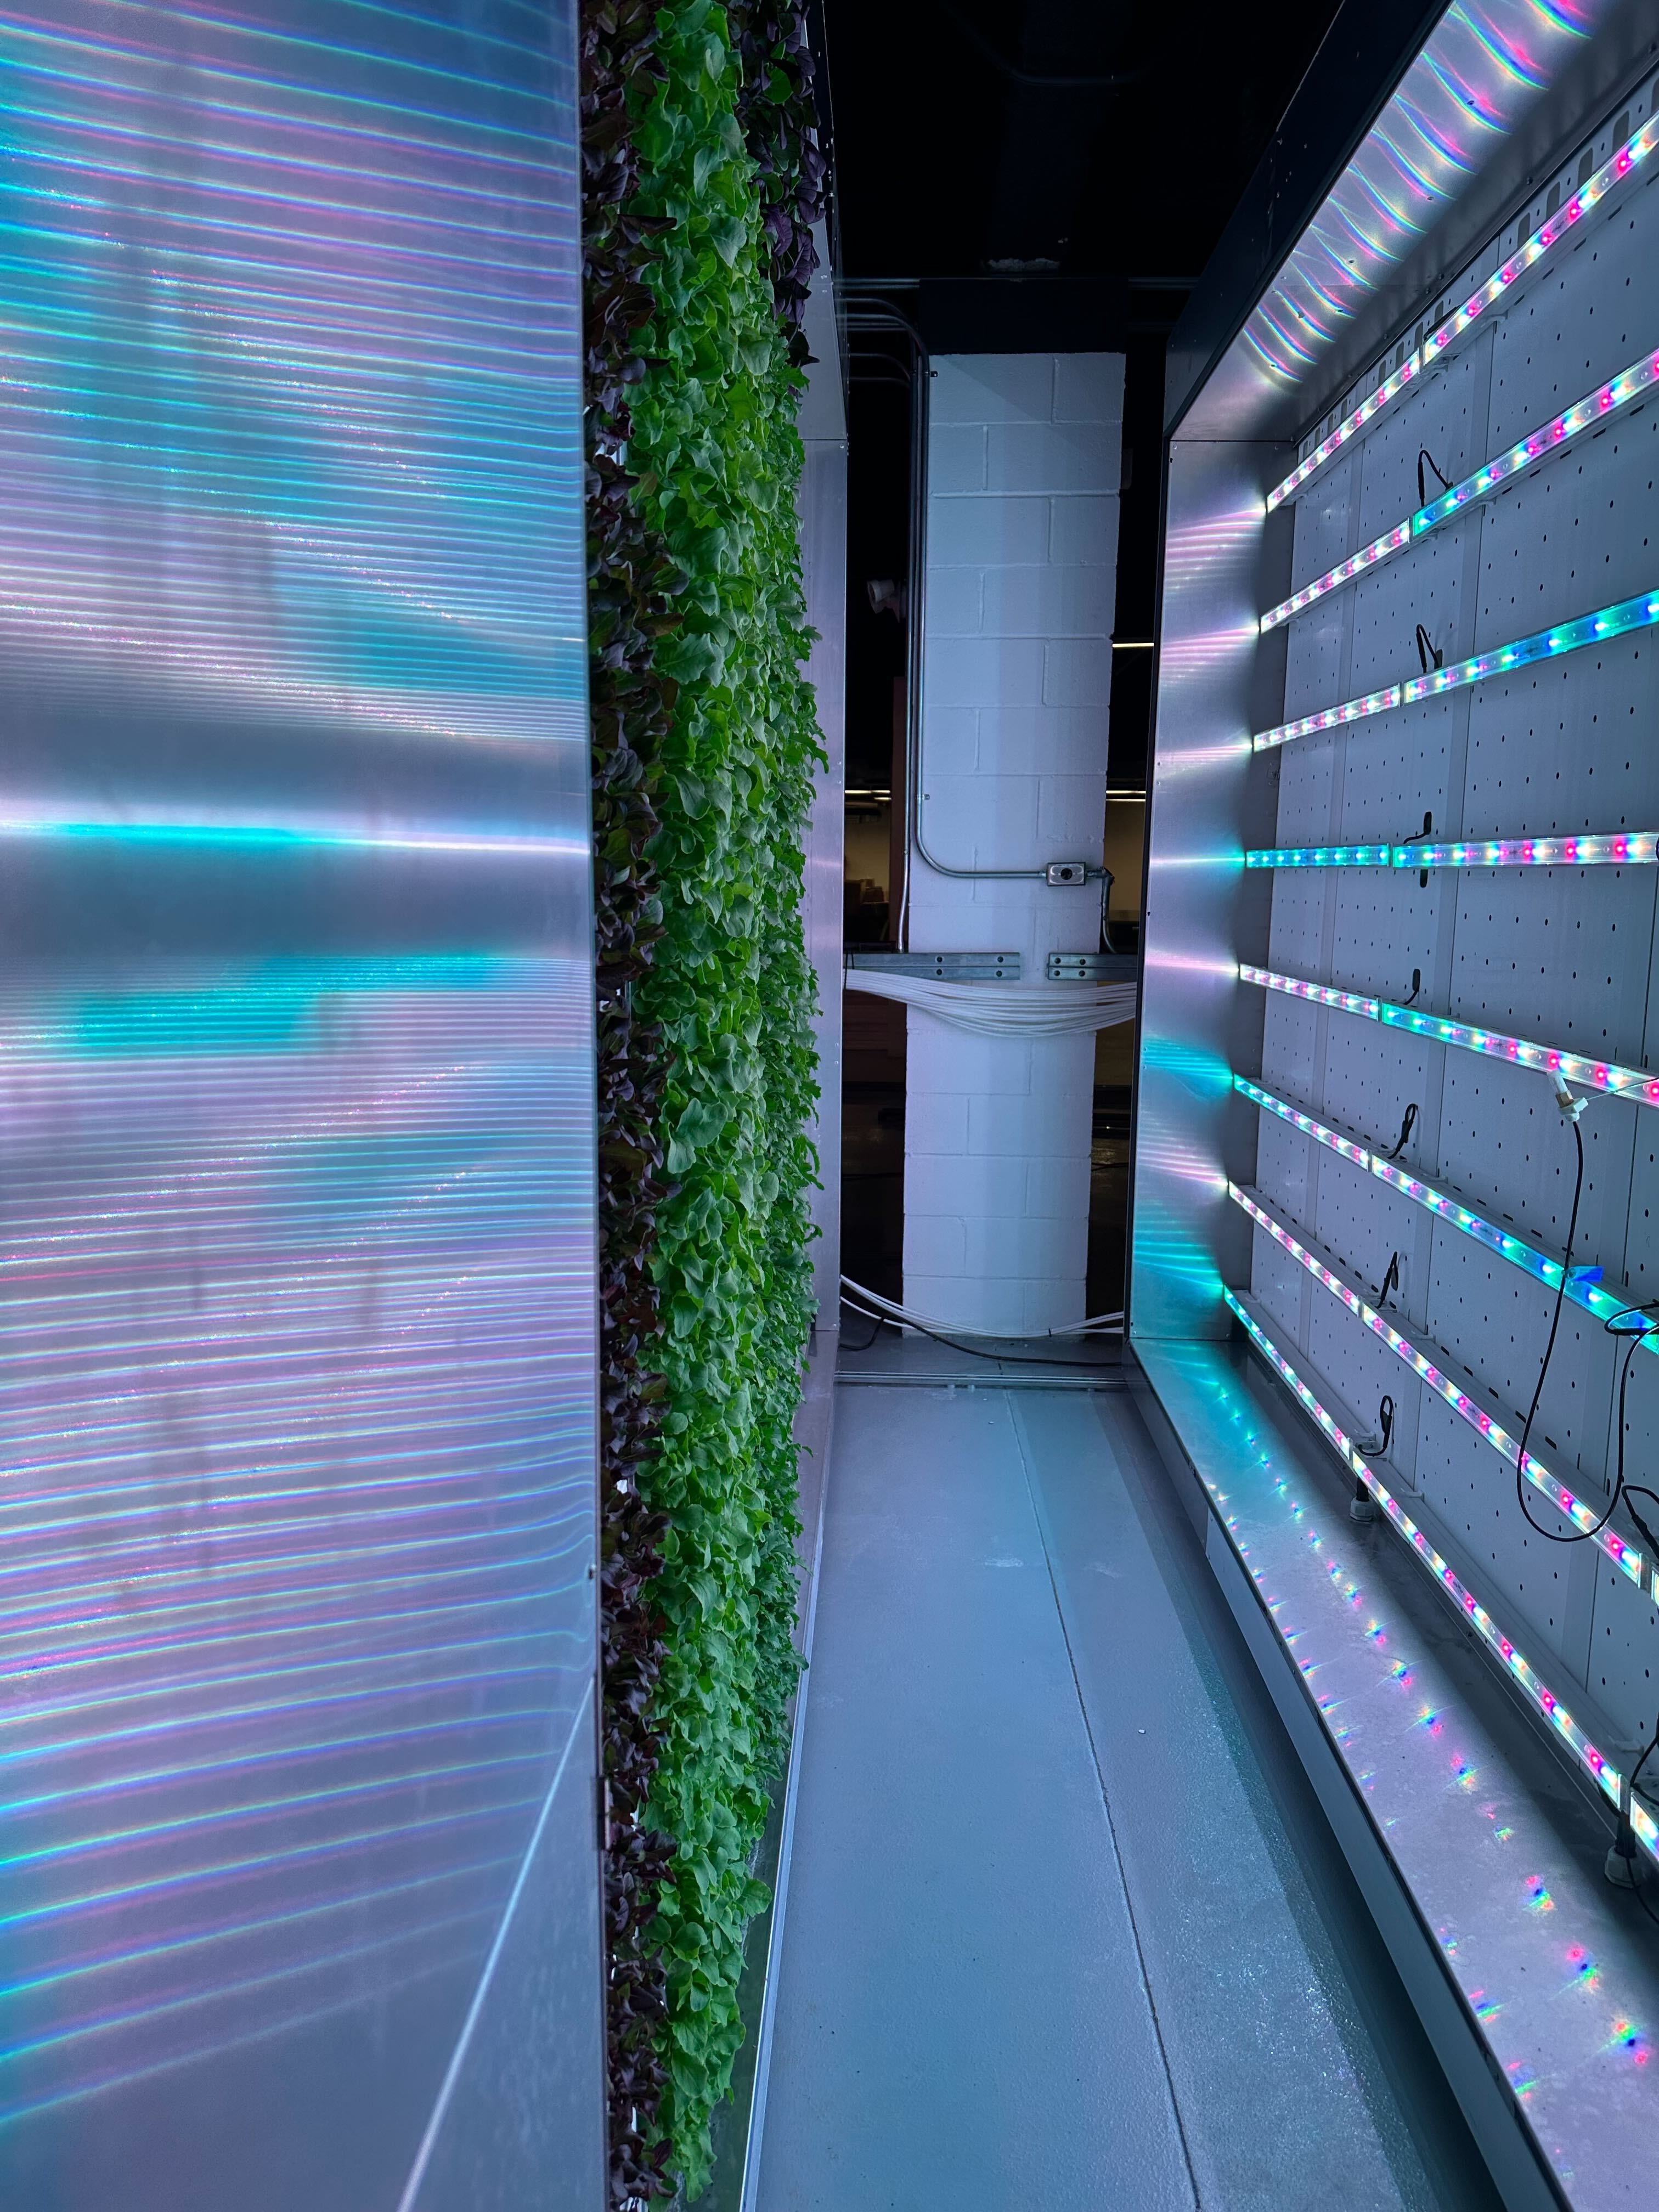
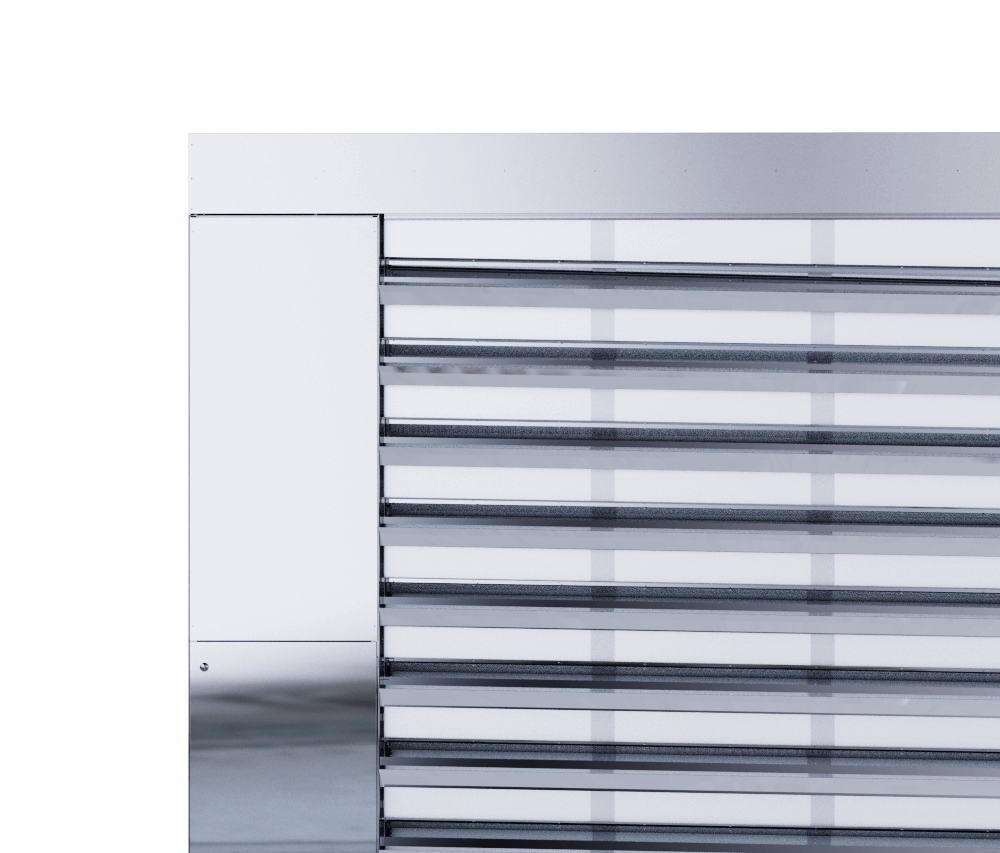
Light/Air side
On the right side, individual light spectrums are controlled with specialized LED lights, while the air is controlled through small air holes in the air curtains.
Planning
How will farmers access this page?
There are two main users the will find value from manipulating recipes, growers and plant scientists. Growers will be tweaking, reading and running the recipes while growing out their crops while plant scientists will be pushing the boundaries of the recipe's capabilities to yield new growing insights.
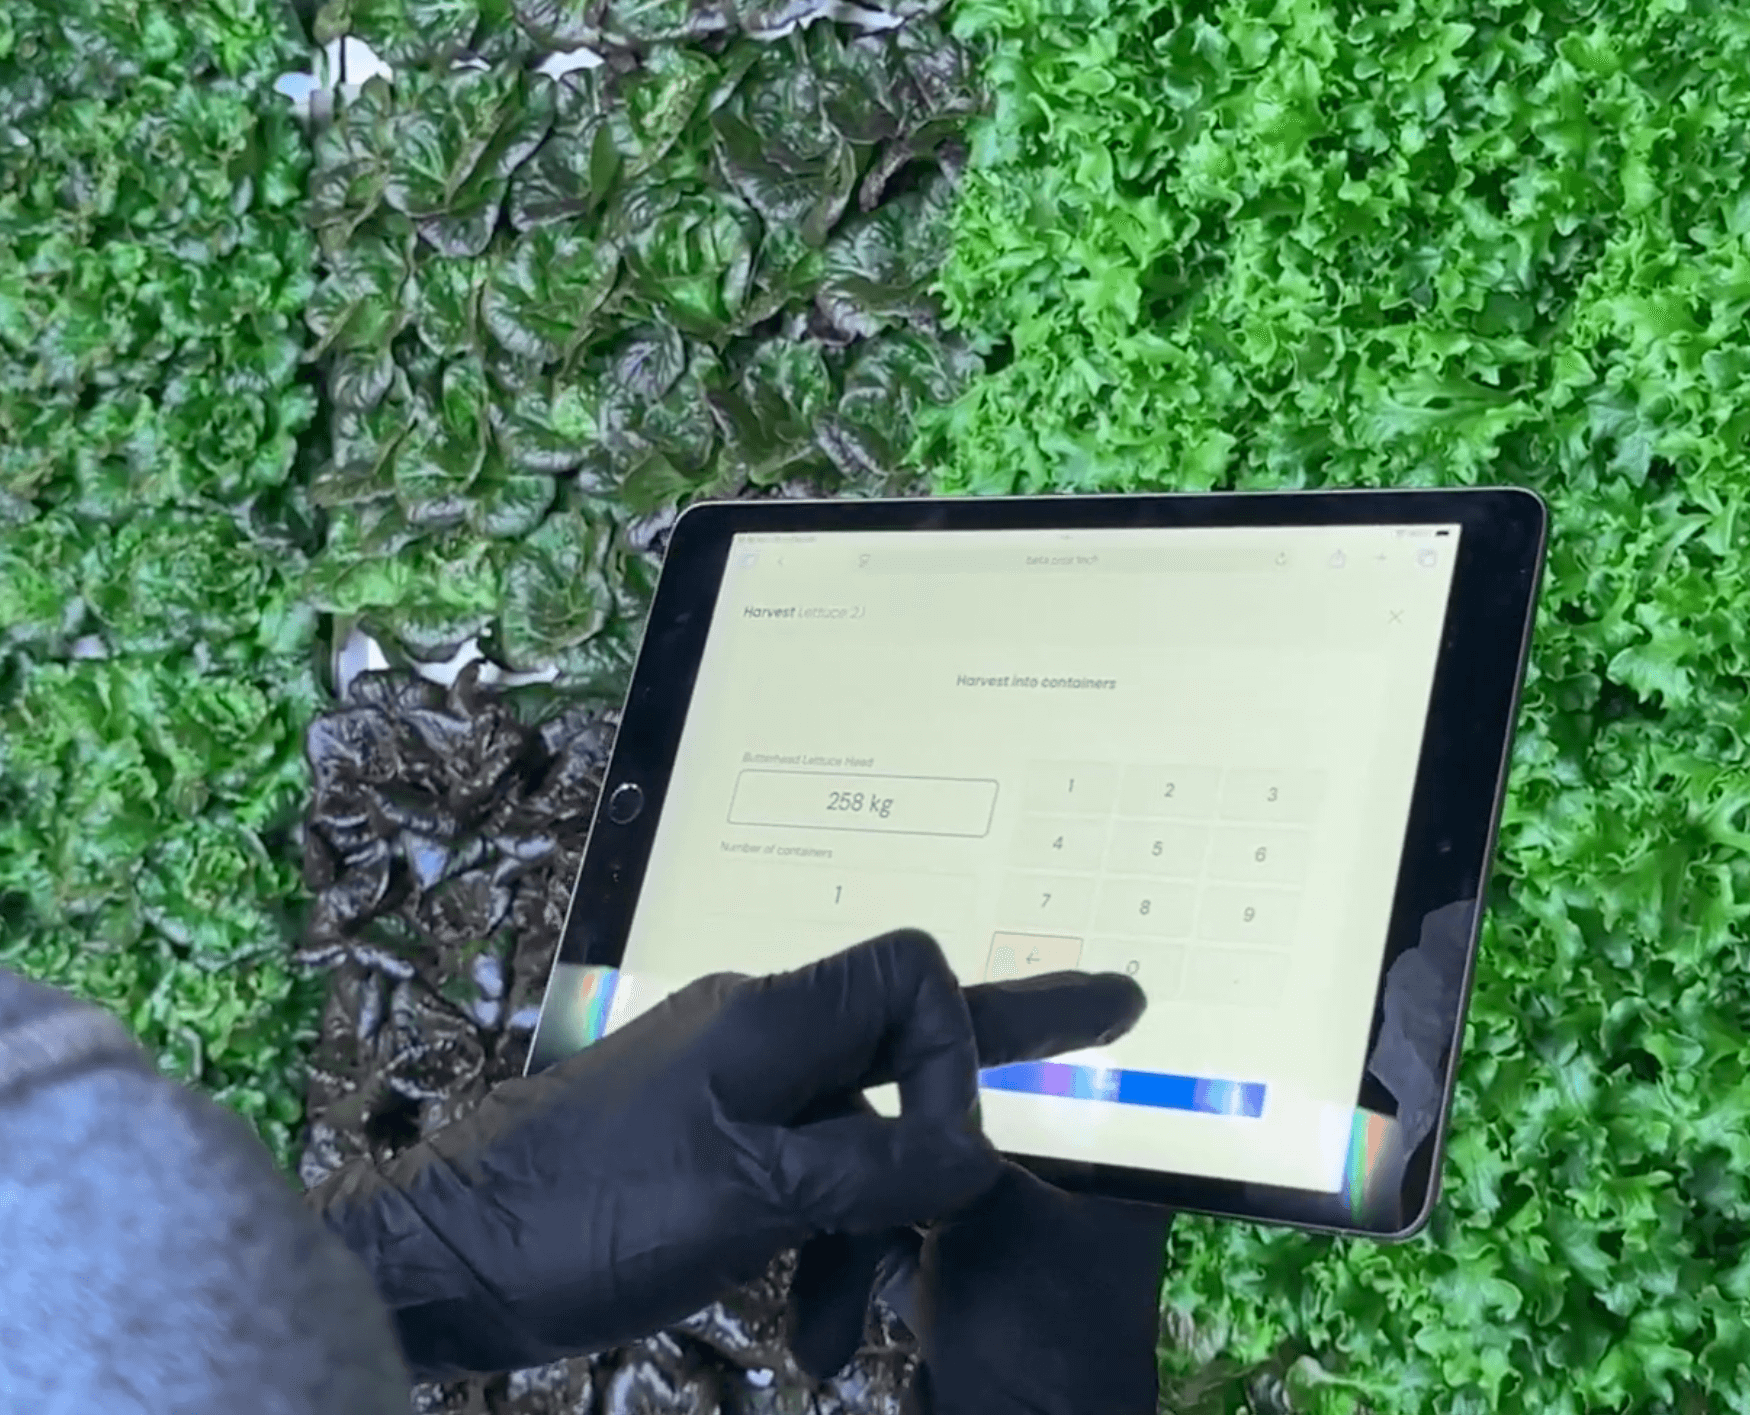
Active farming
- Likely done on tablet or mobile phone
- Looking for relevant status information
- Cares about active info
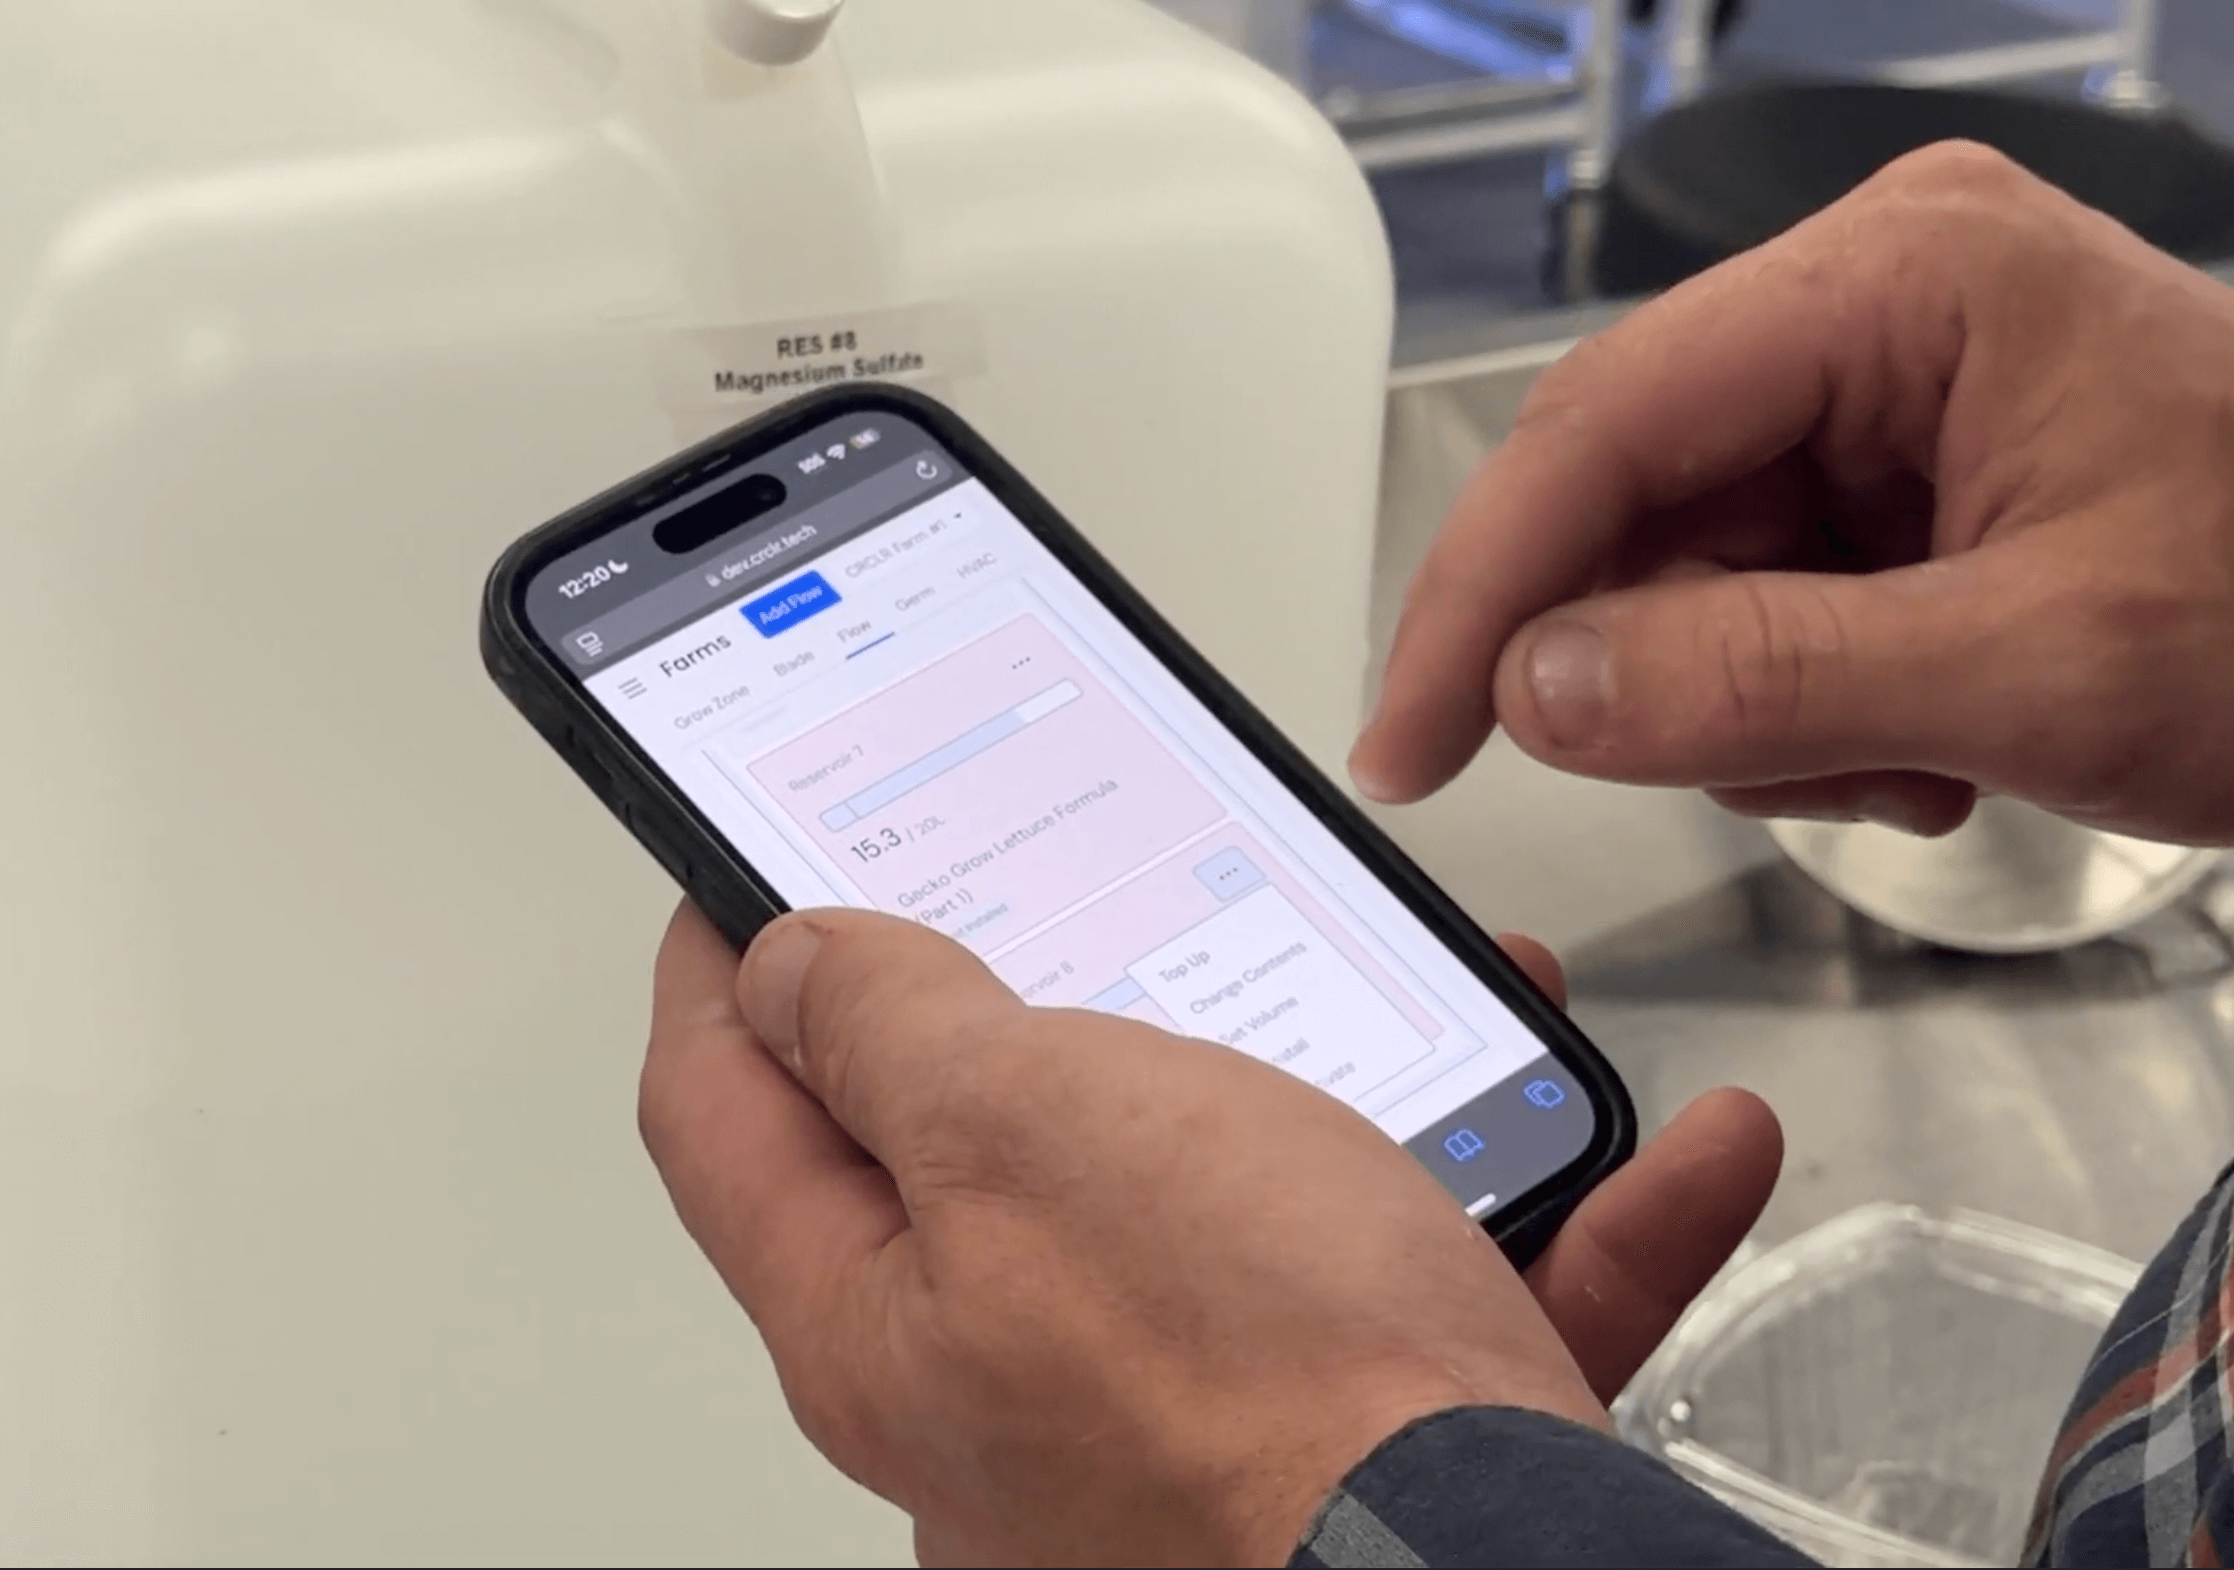
Remote monitoring
- Accessed on any device type
- Looking for issues or anomalies
- Cares about active & historic info
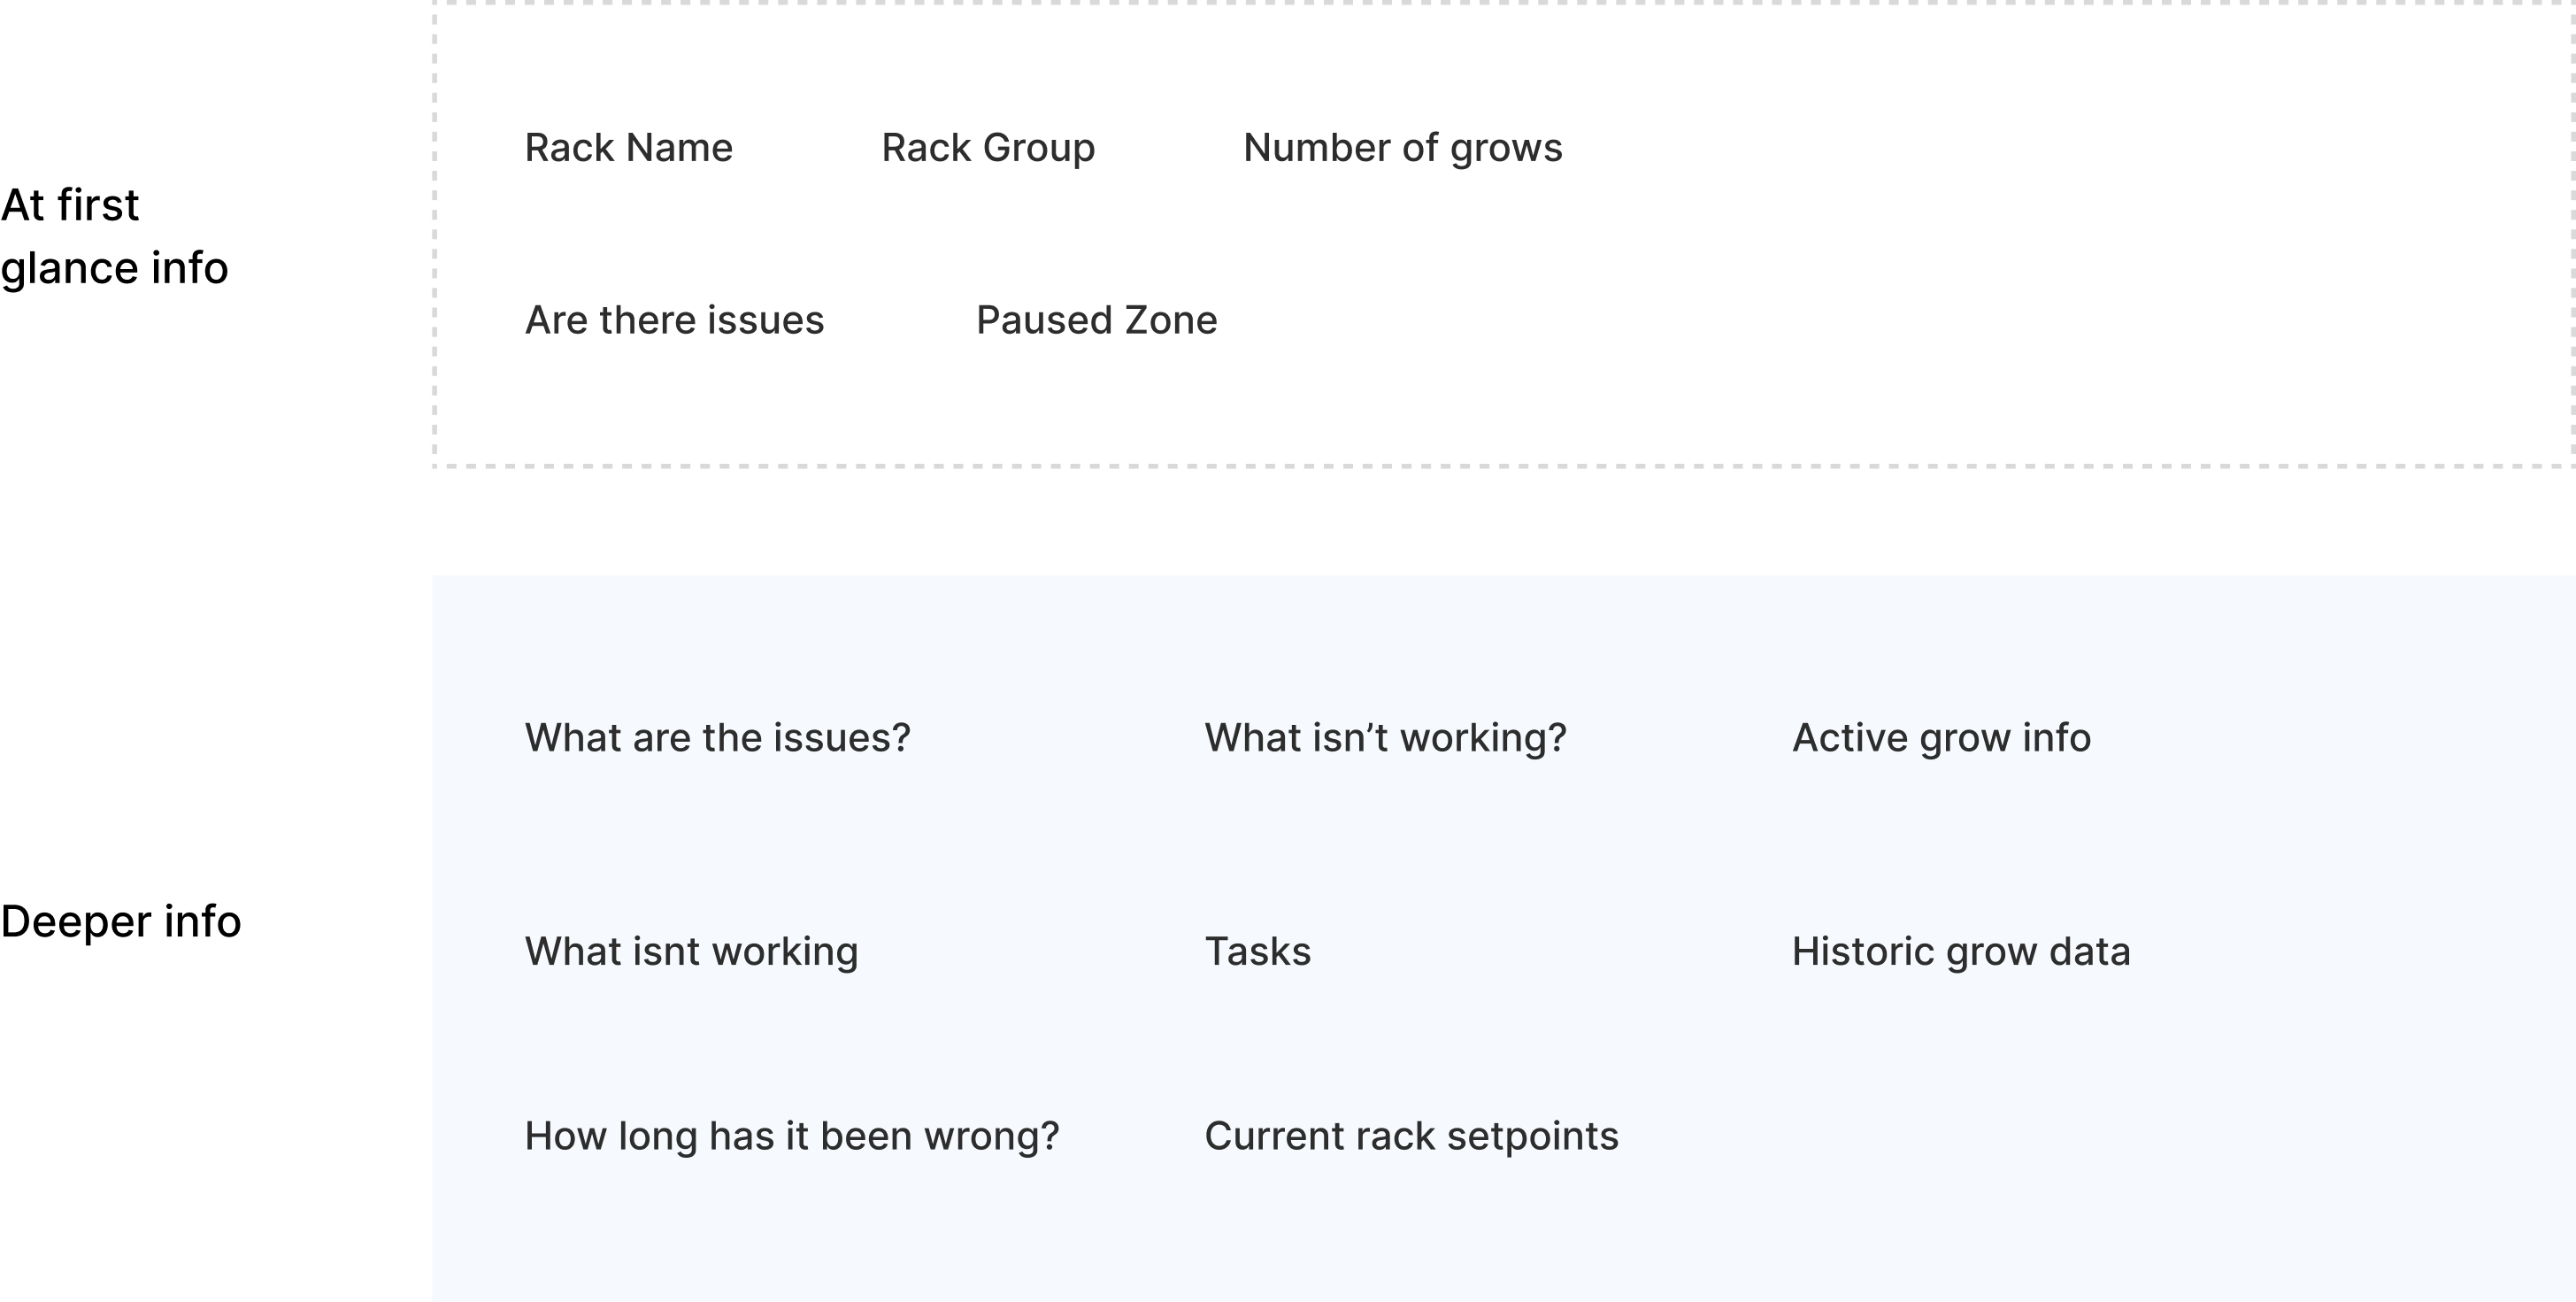
What info matters in a zone?
Based on discussions with farmers using our sytem, we built a list to group the ideal hierarchy of what they would look for when viewing this page. The groups are split between high priority items to be seen at a glance and more complex items that could be accessed through secondary actions.
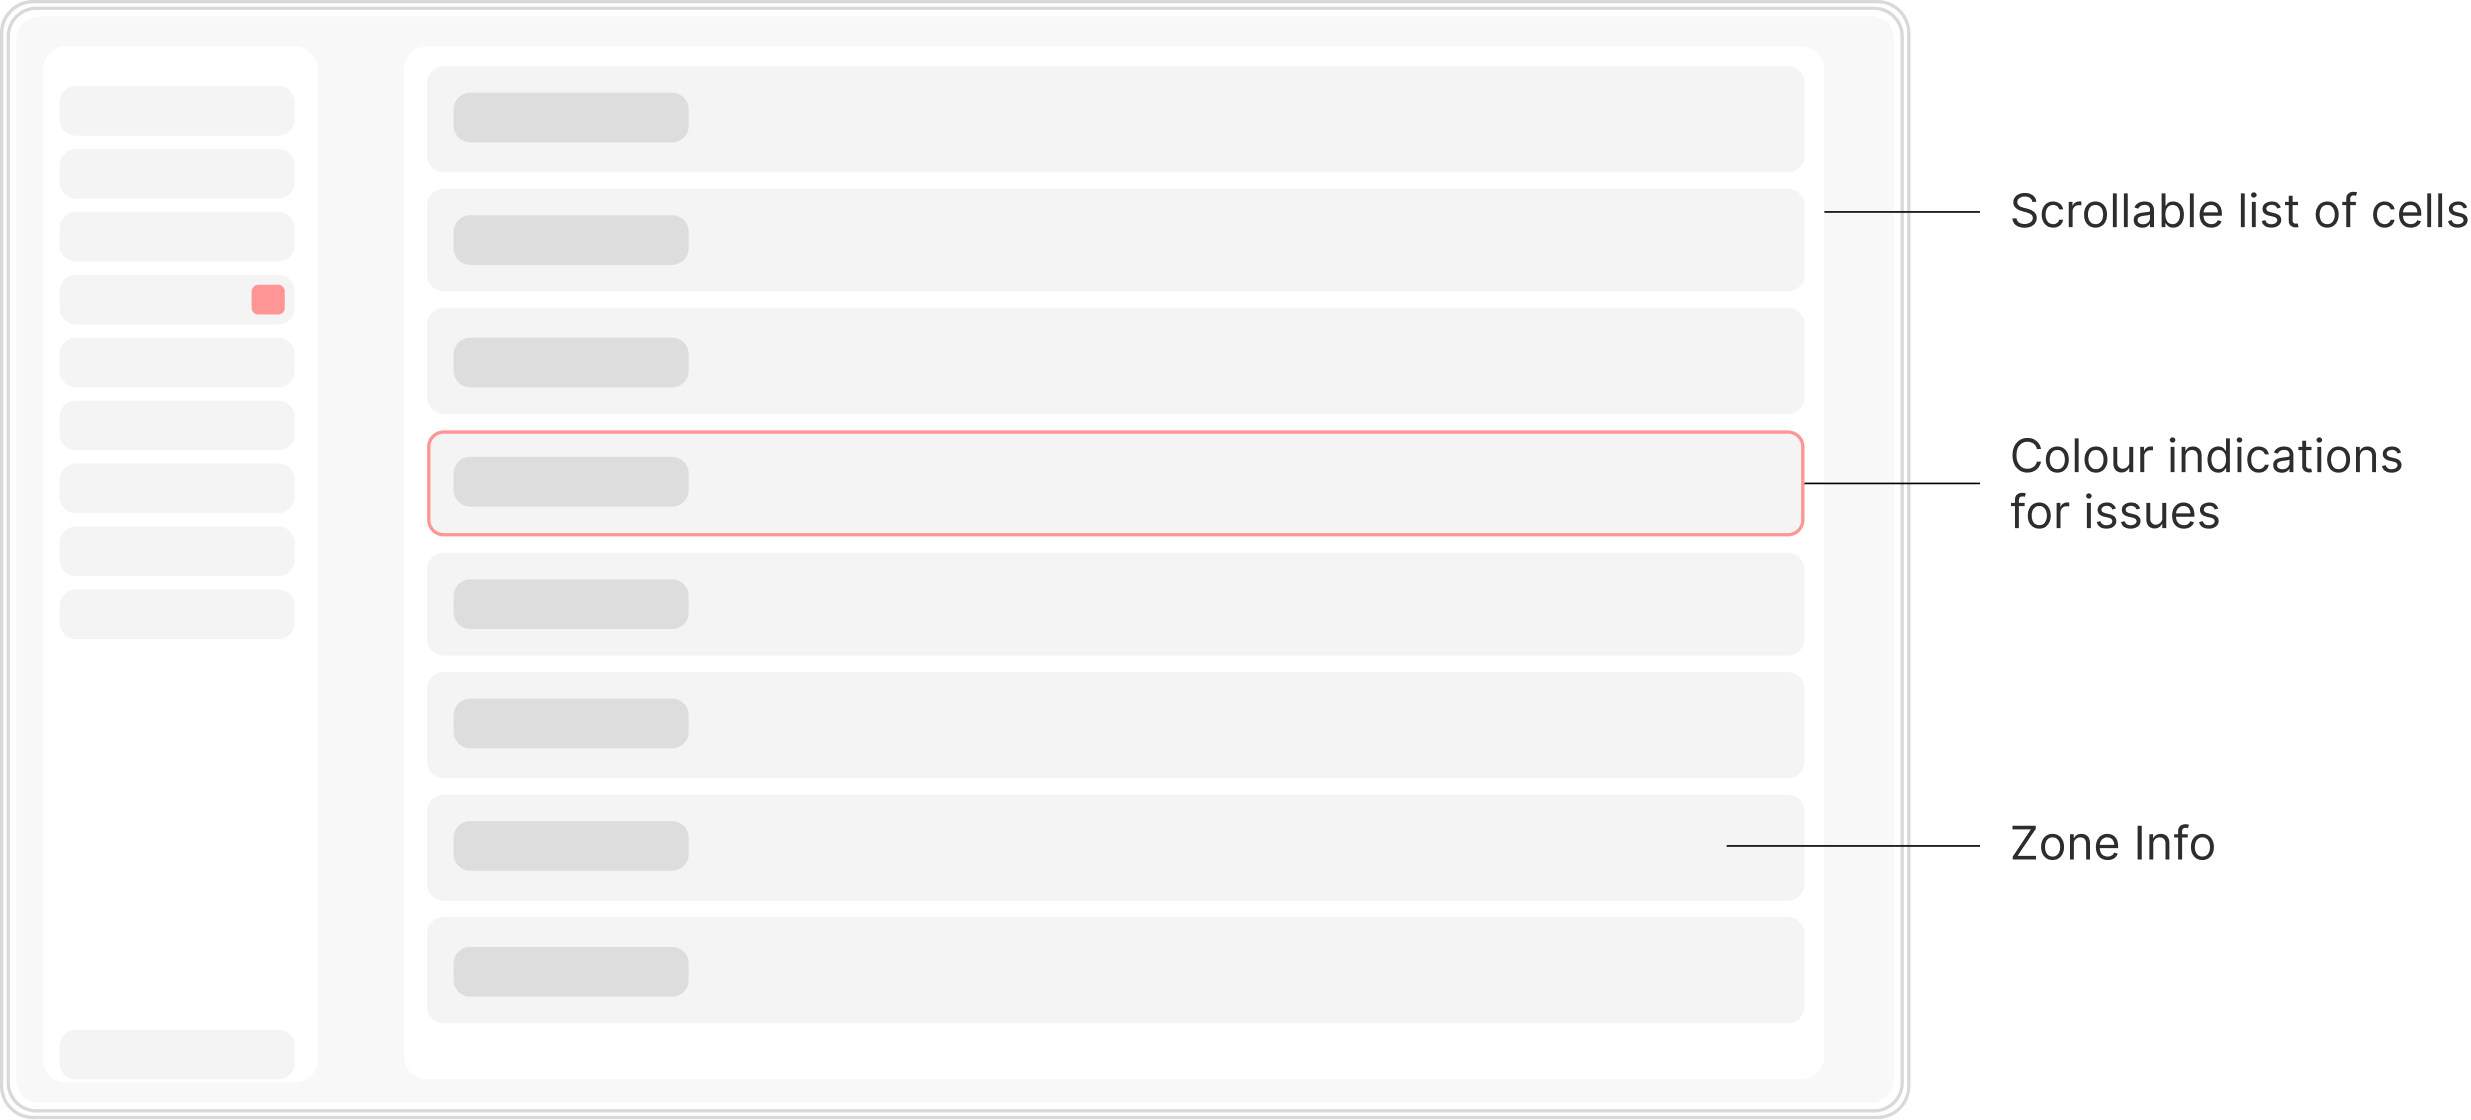
How do we fit info from up to 24 zones in one page
Stacked Cells
We built out a framework similar to how we designed other pages on our site for familiarity. The concept involves a scrollable list of cells containing relevant primary information.
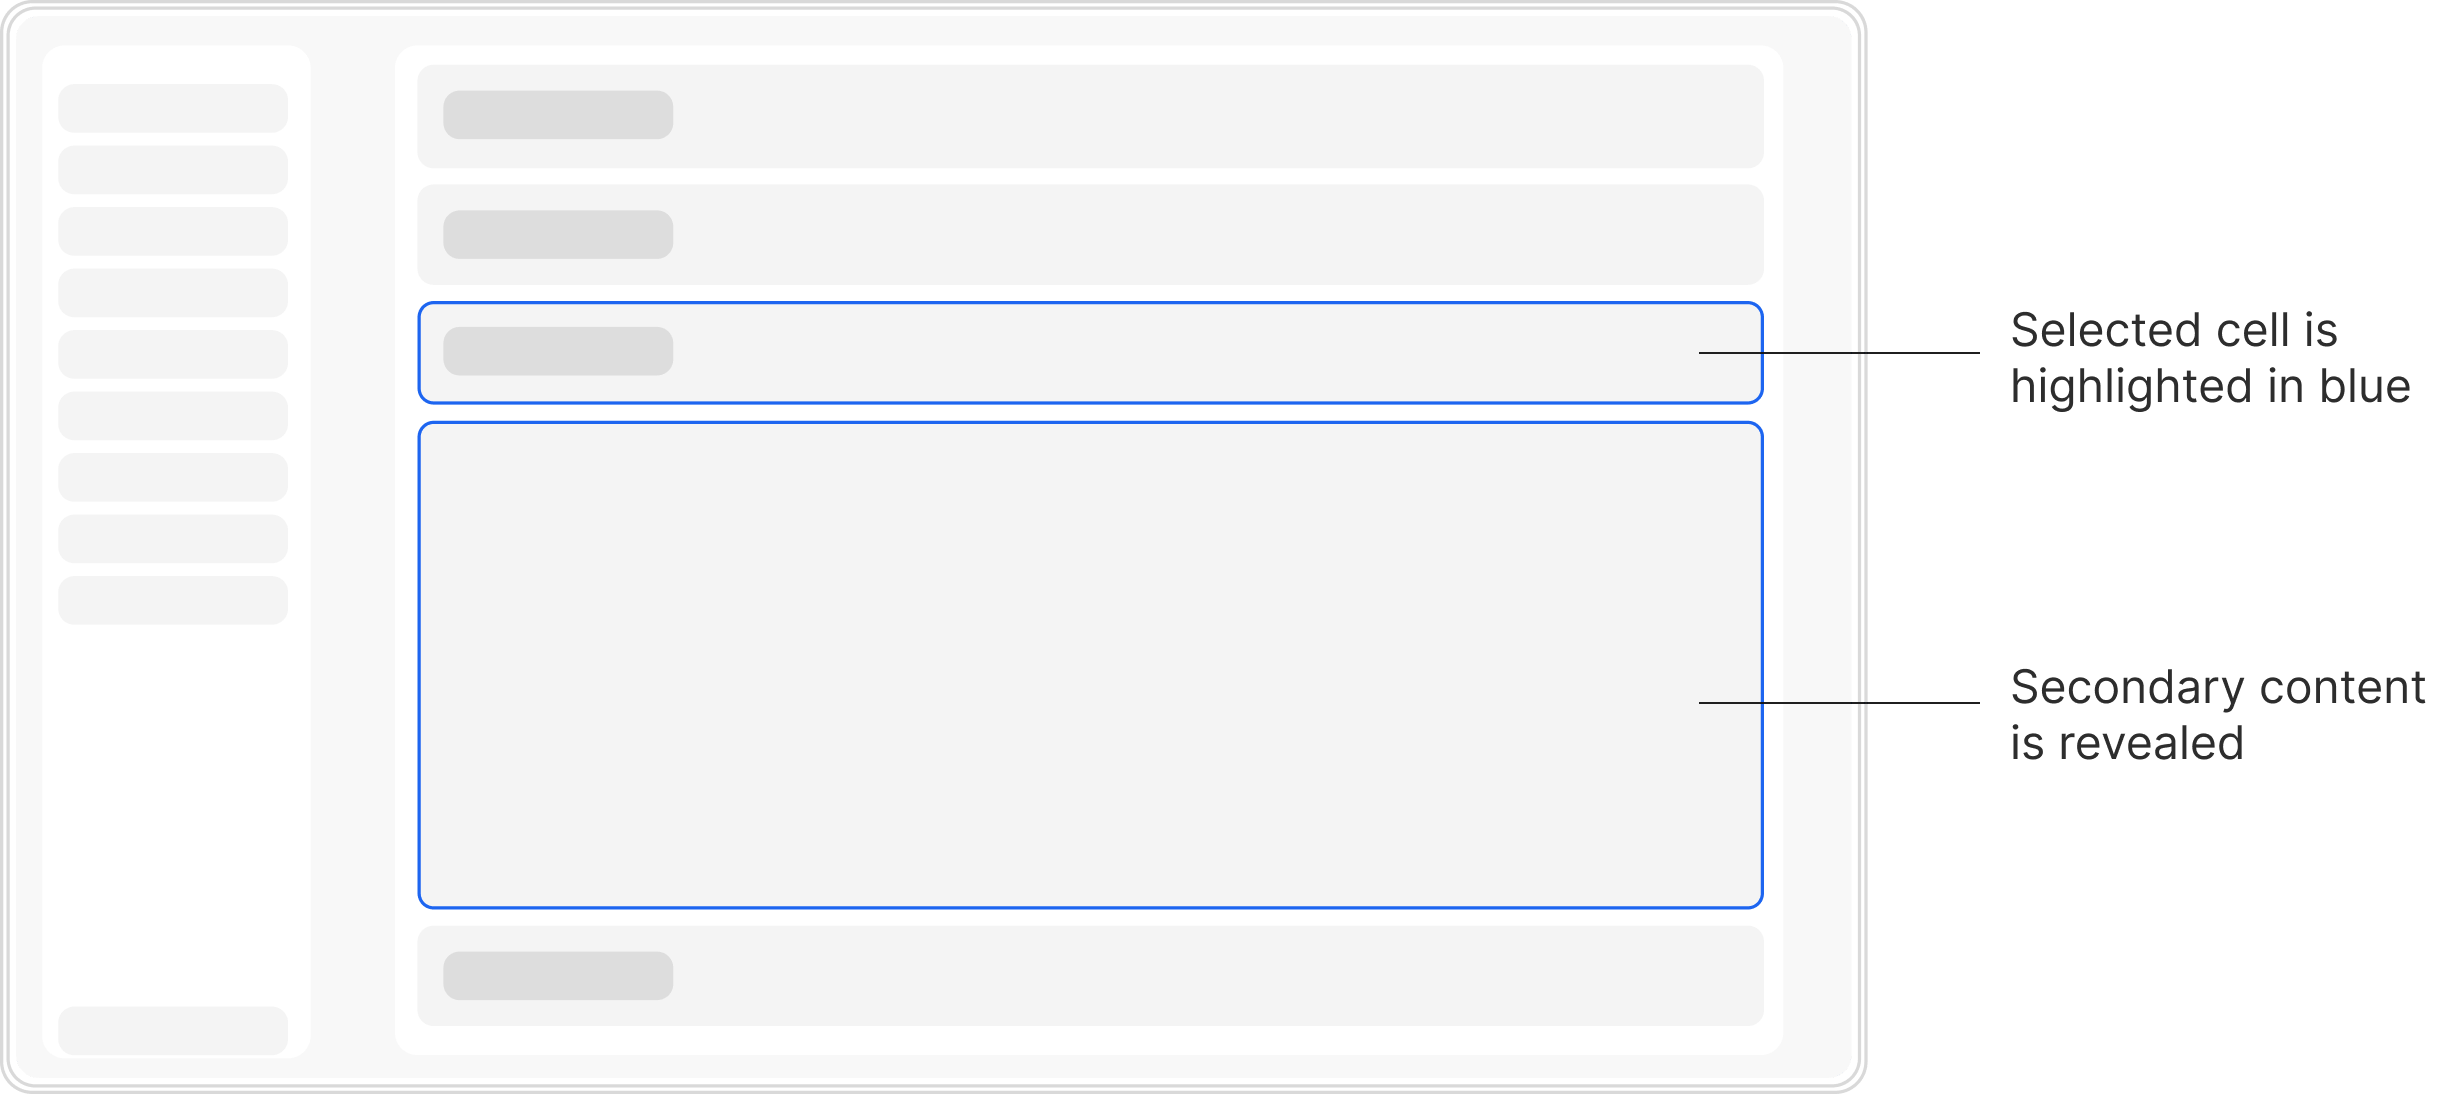
Expanded states
Clicking a list reveals all of the secondary information & interactions. A blue outer border denotes the selected zone's area as well as the connected sencondary info.
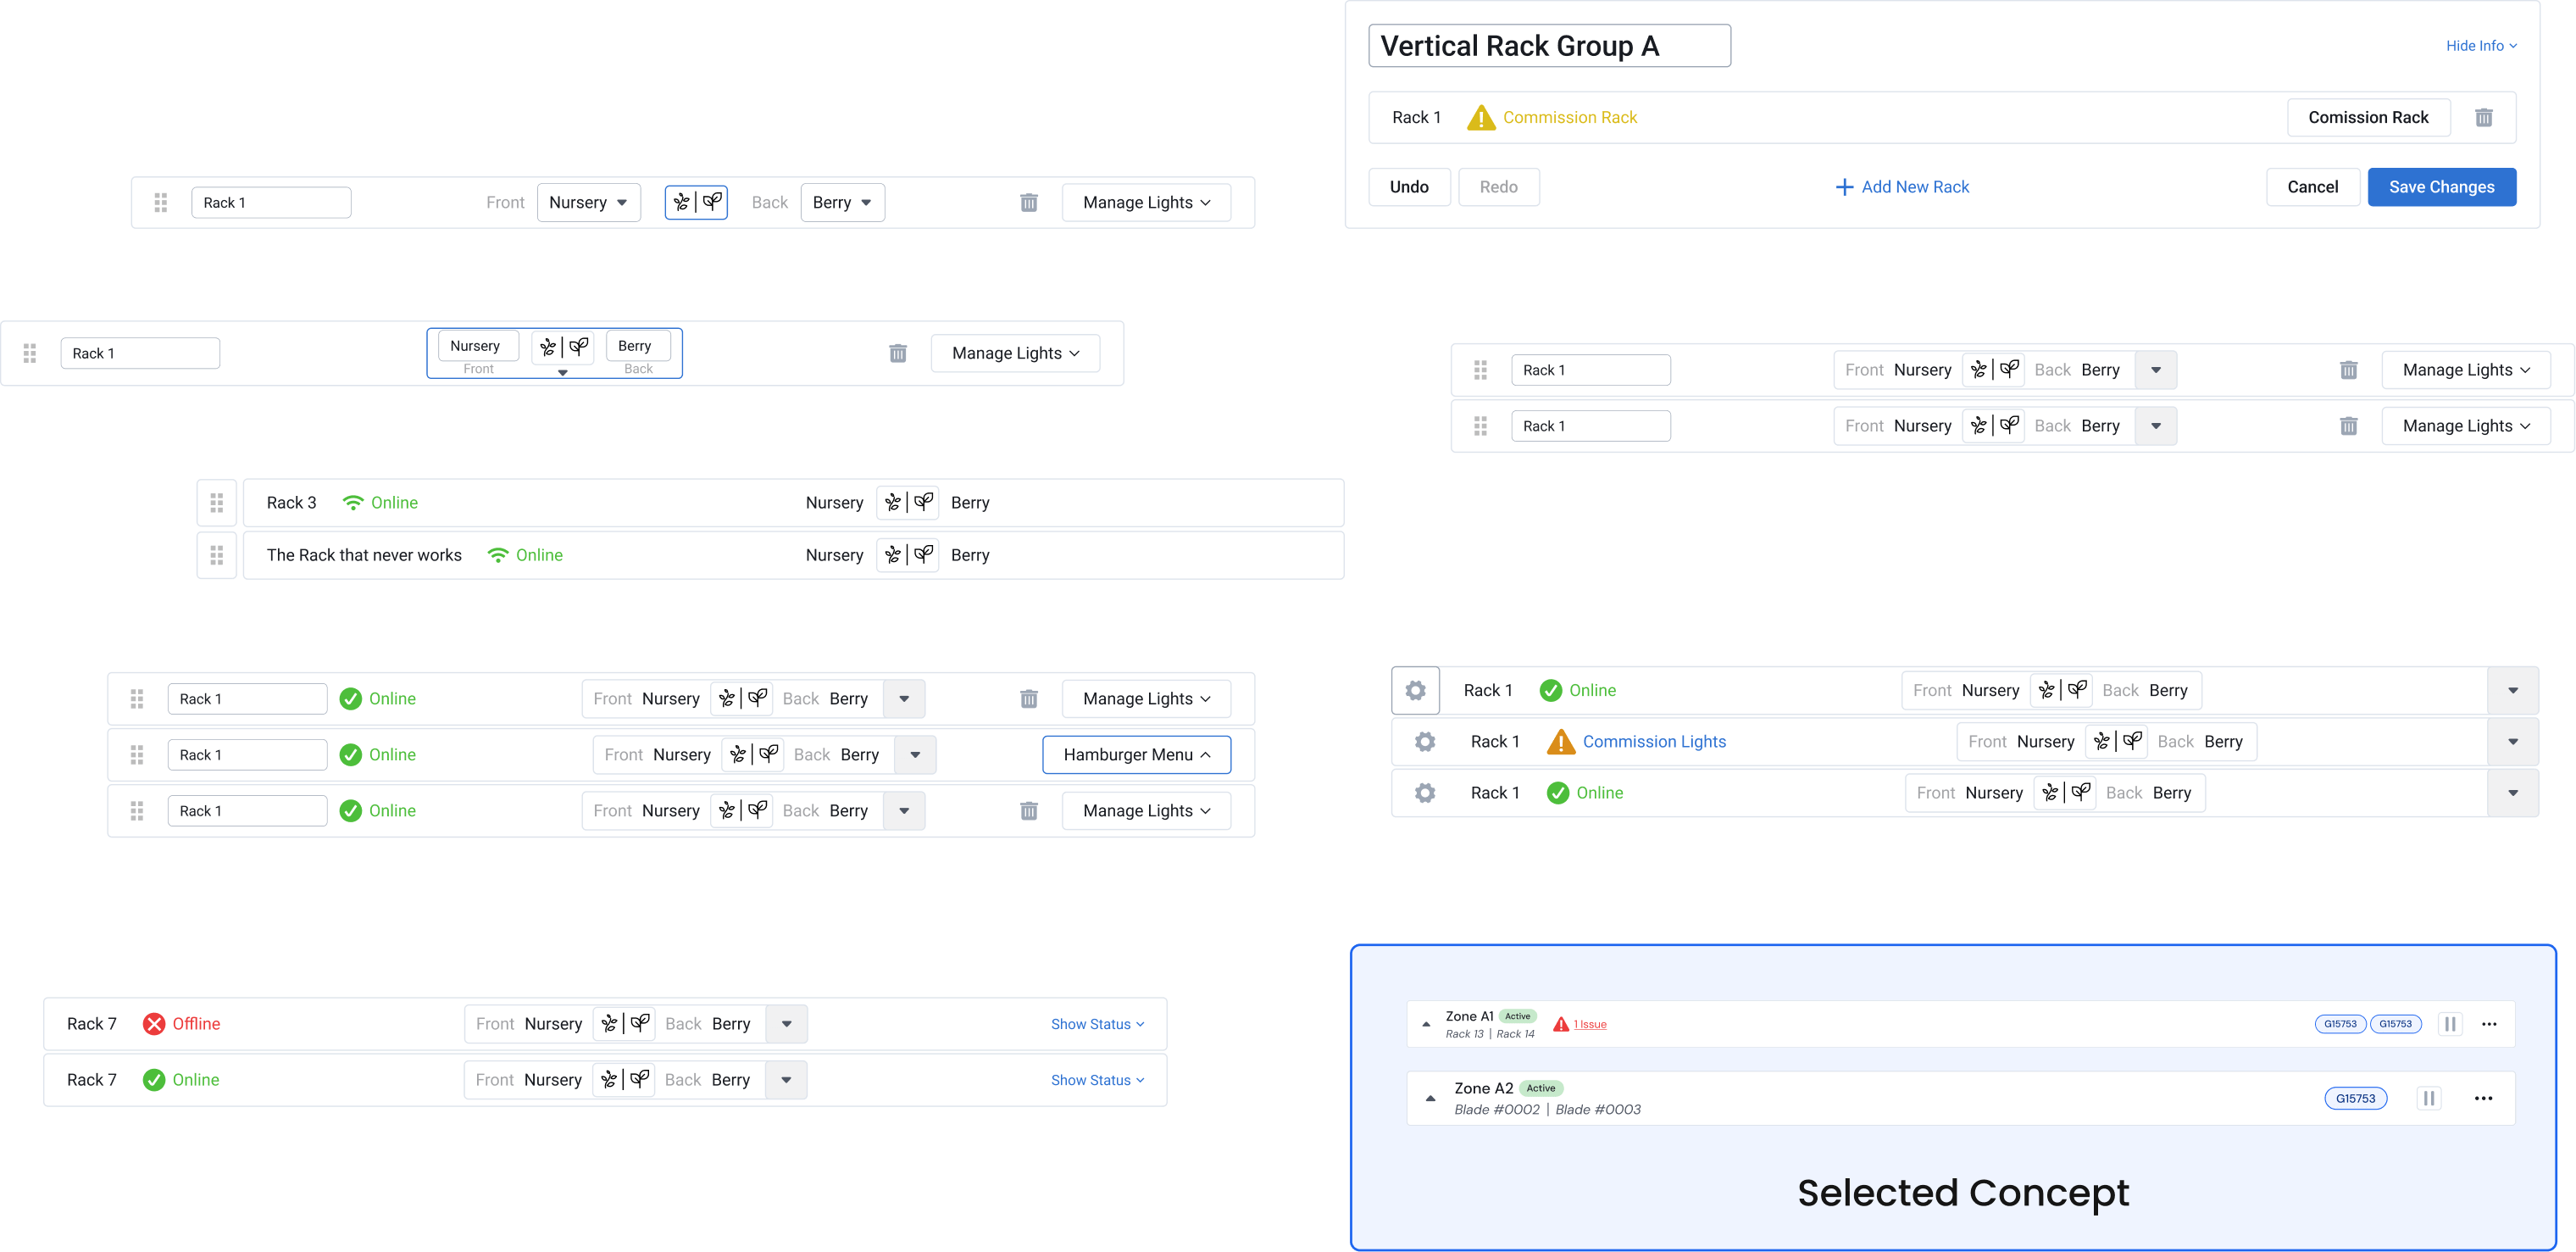
Design exploration
When arriving at the cell concept we experimented with some different ways of displaying the primary info into a small space. The challenge is mainly having multiple states around the current status using colour as well as dealing with potentially 100 character long names.
Design
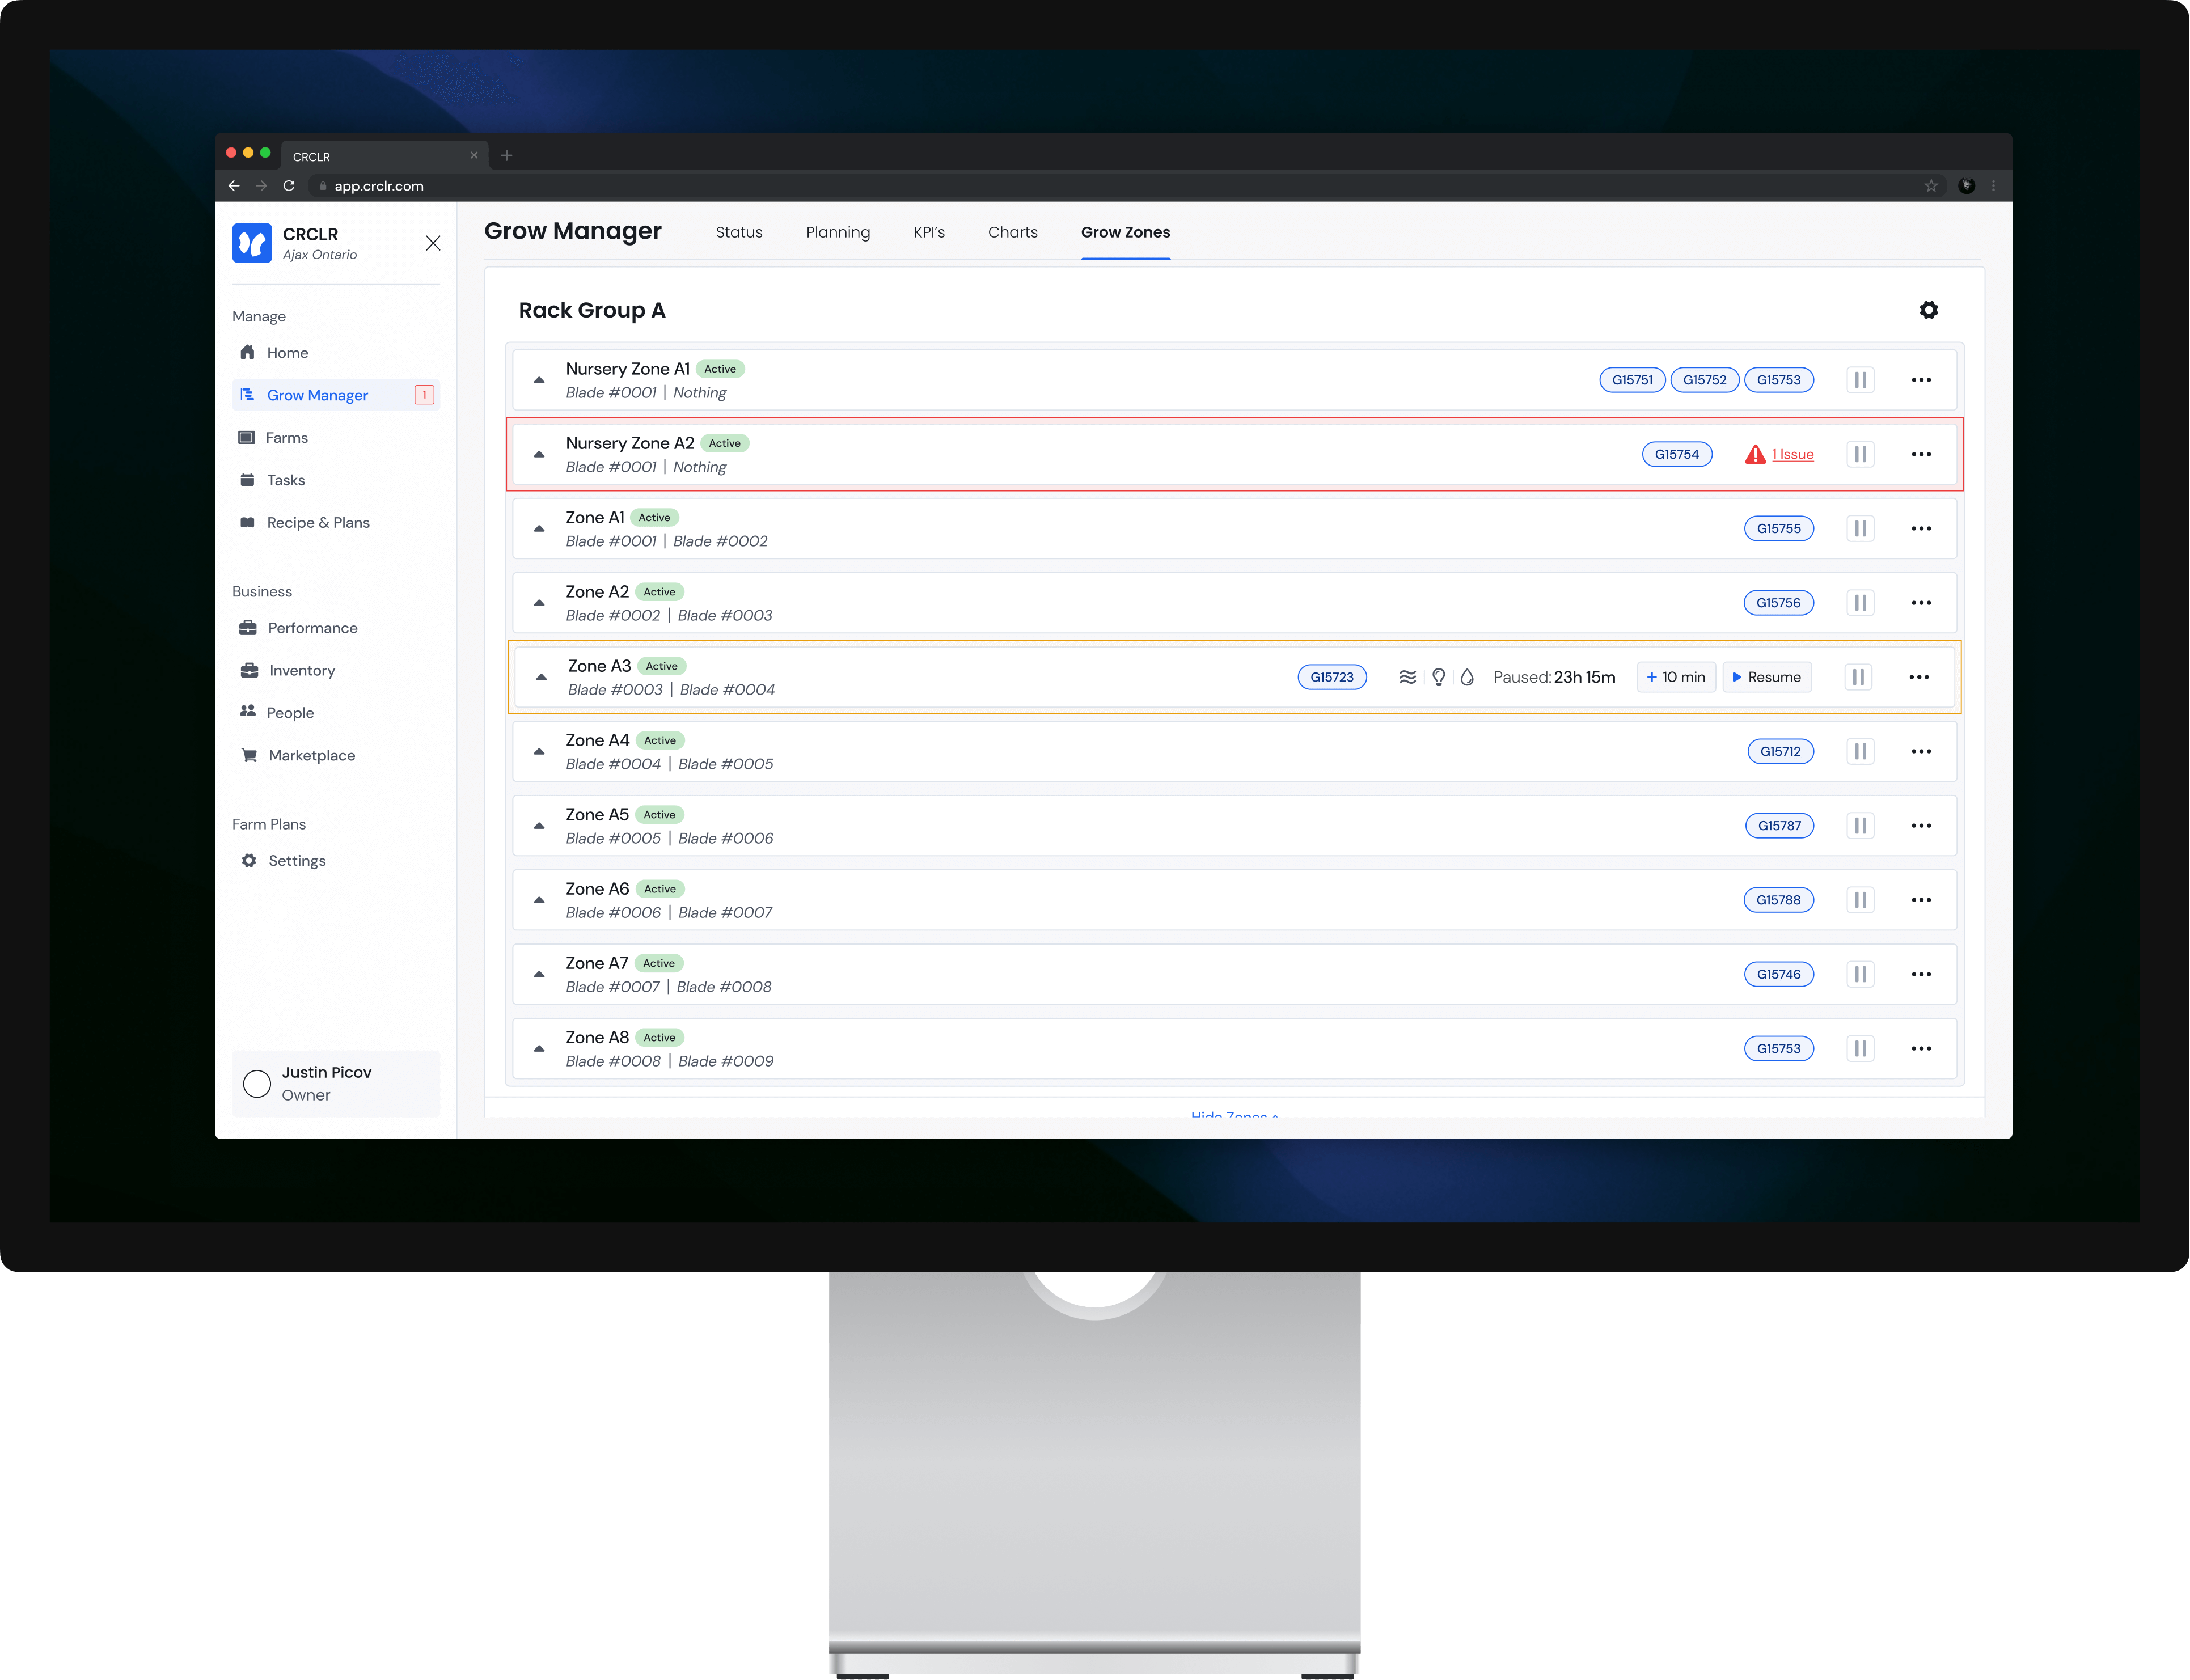
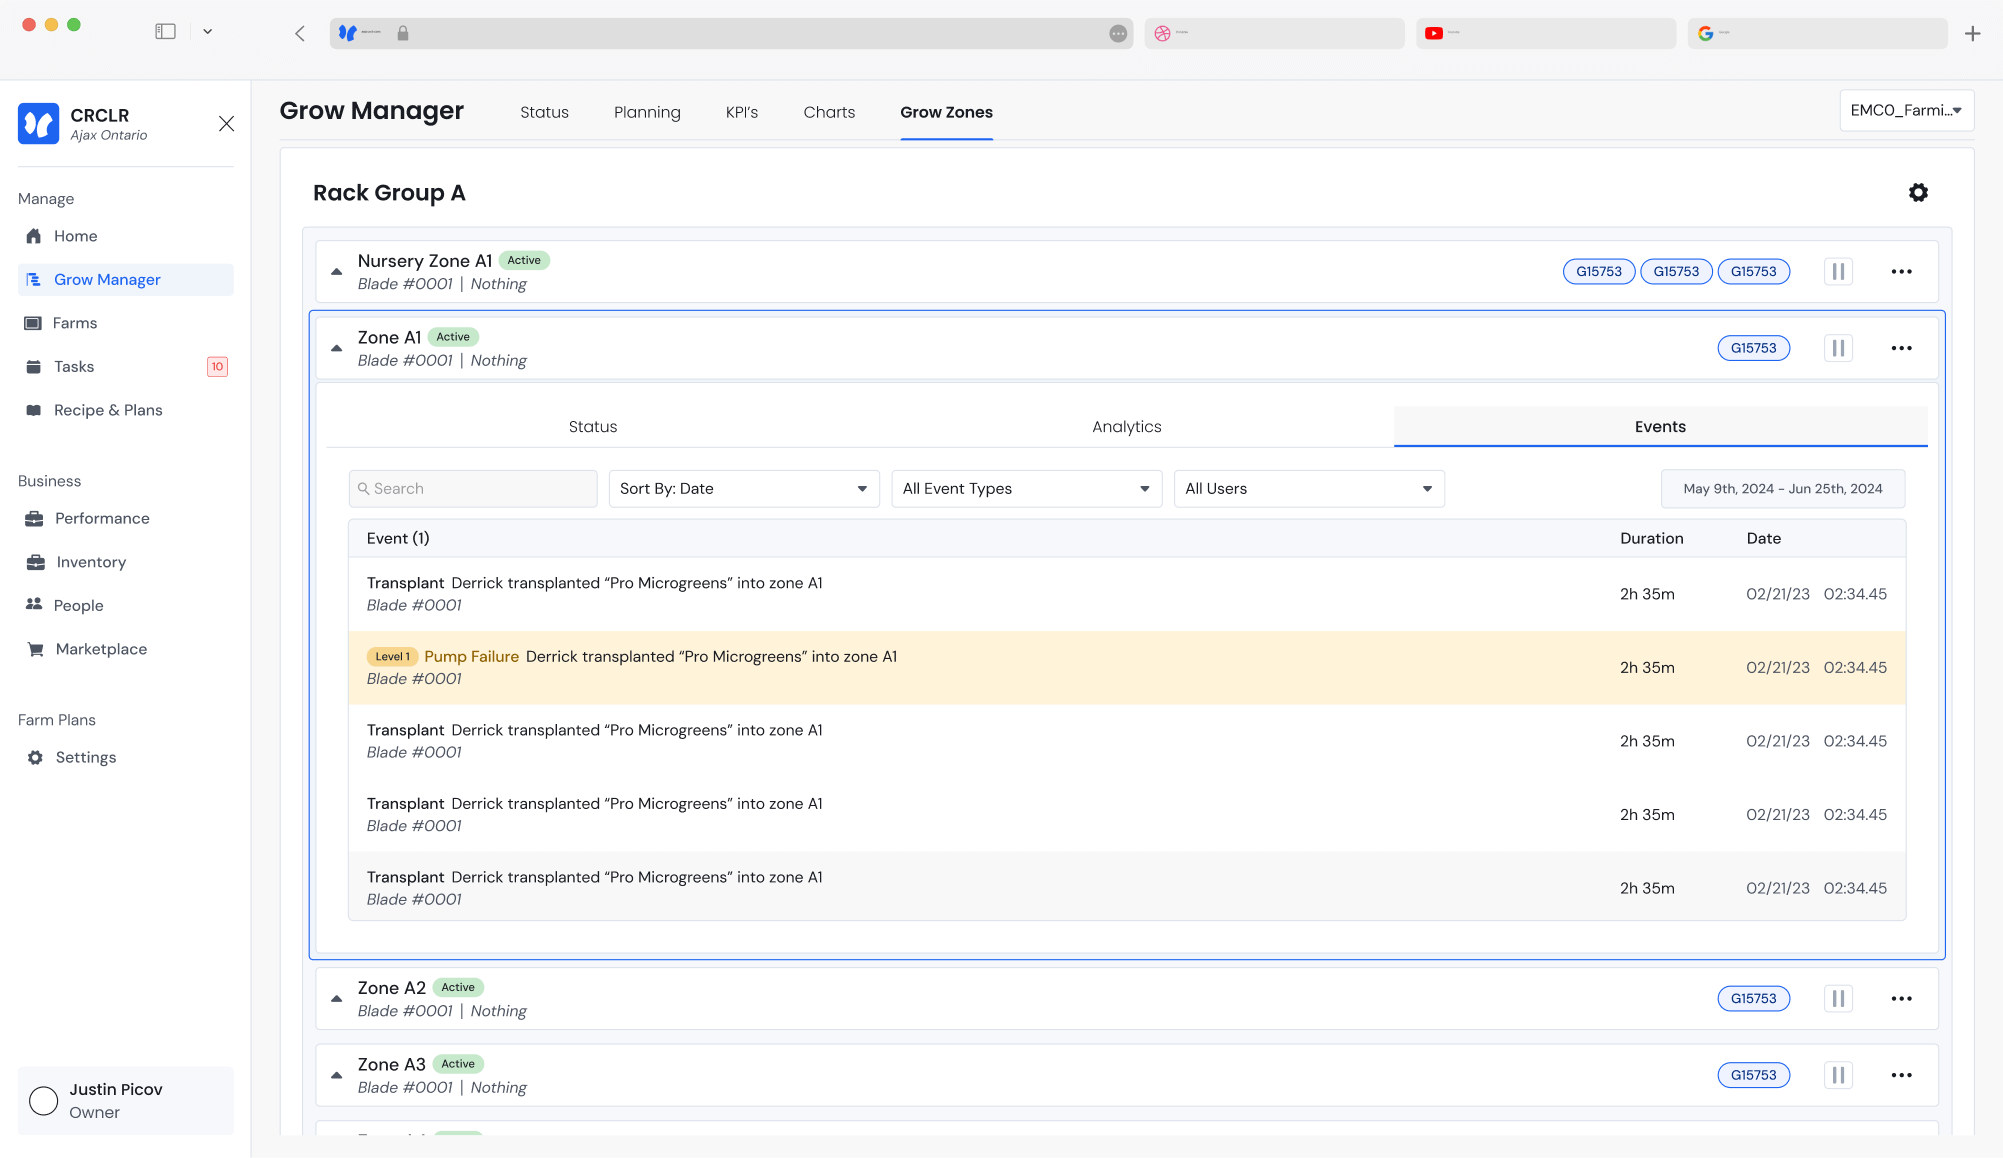
How can I tell what is happening in the zone?
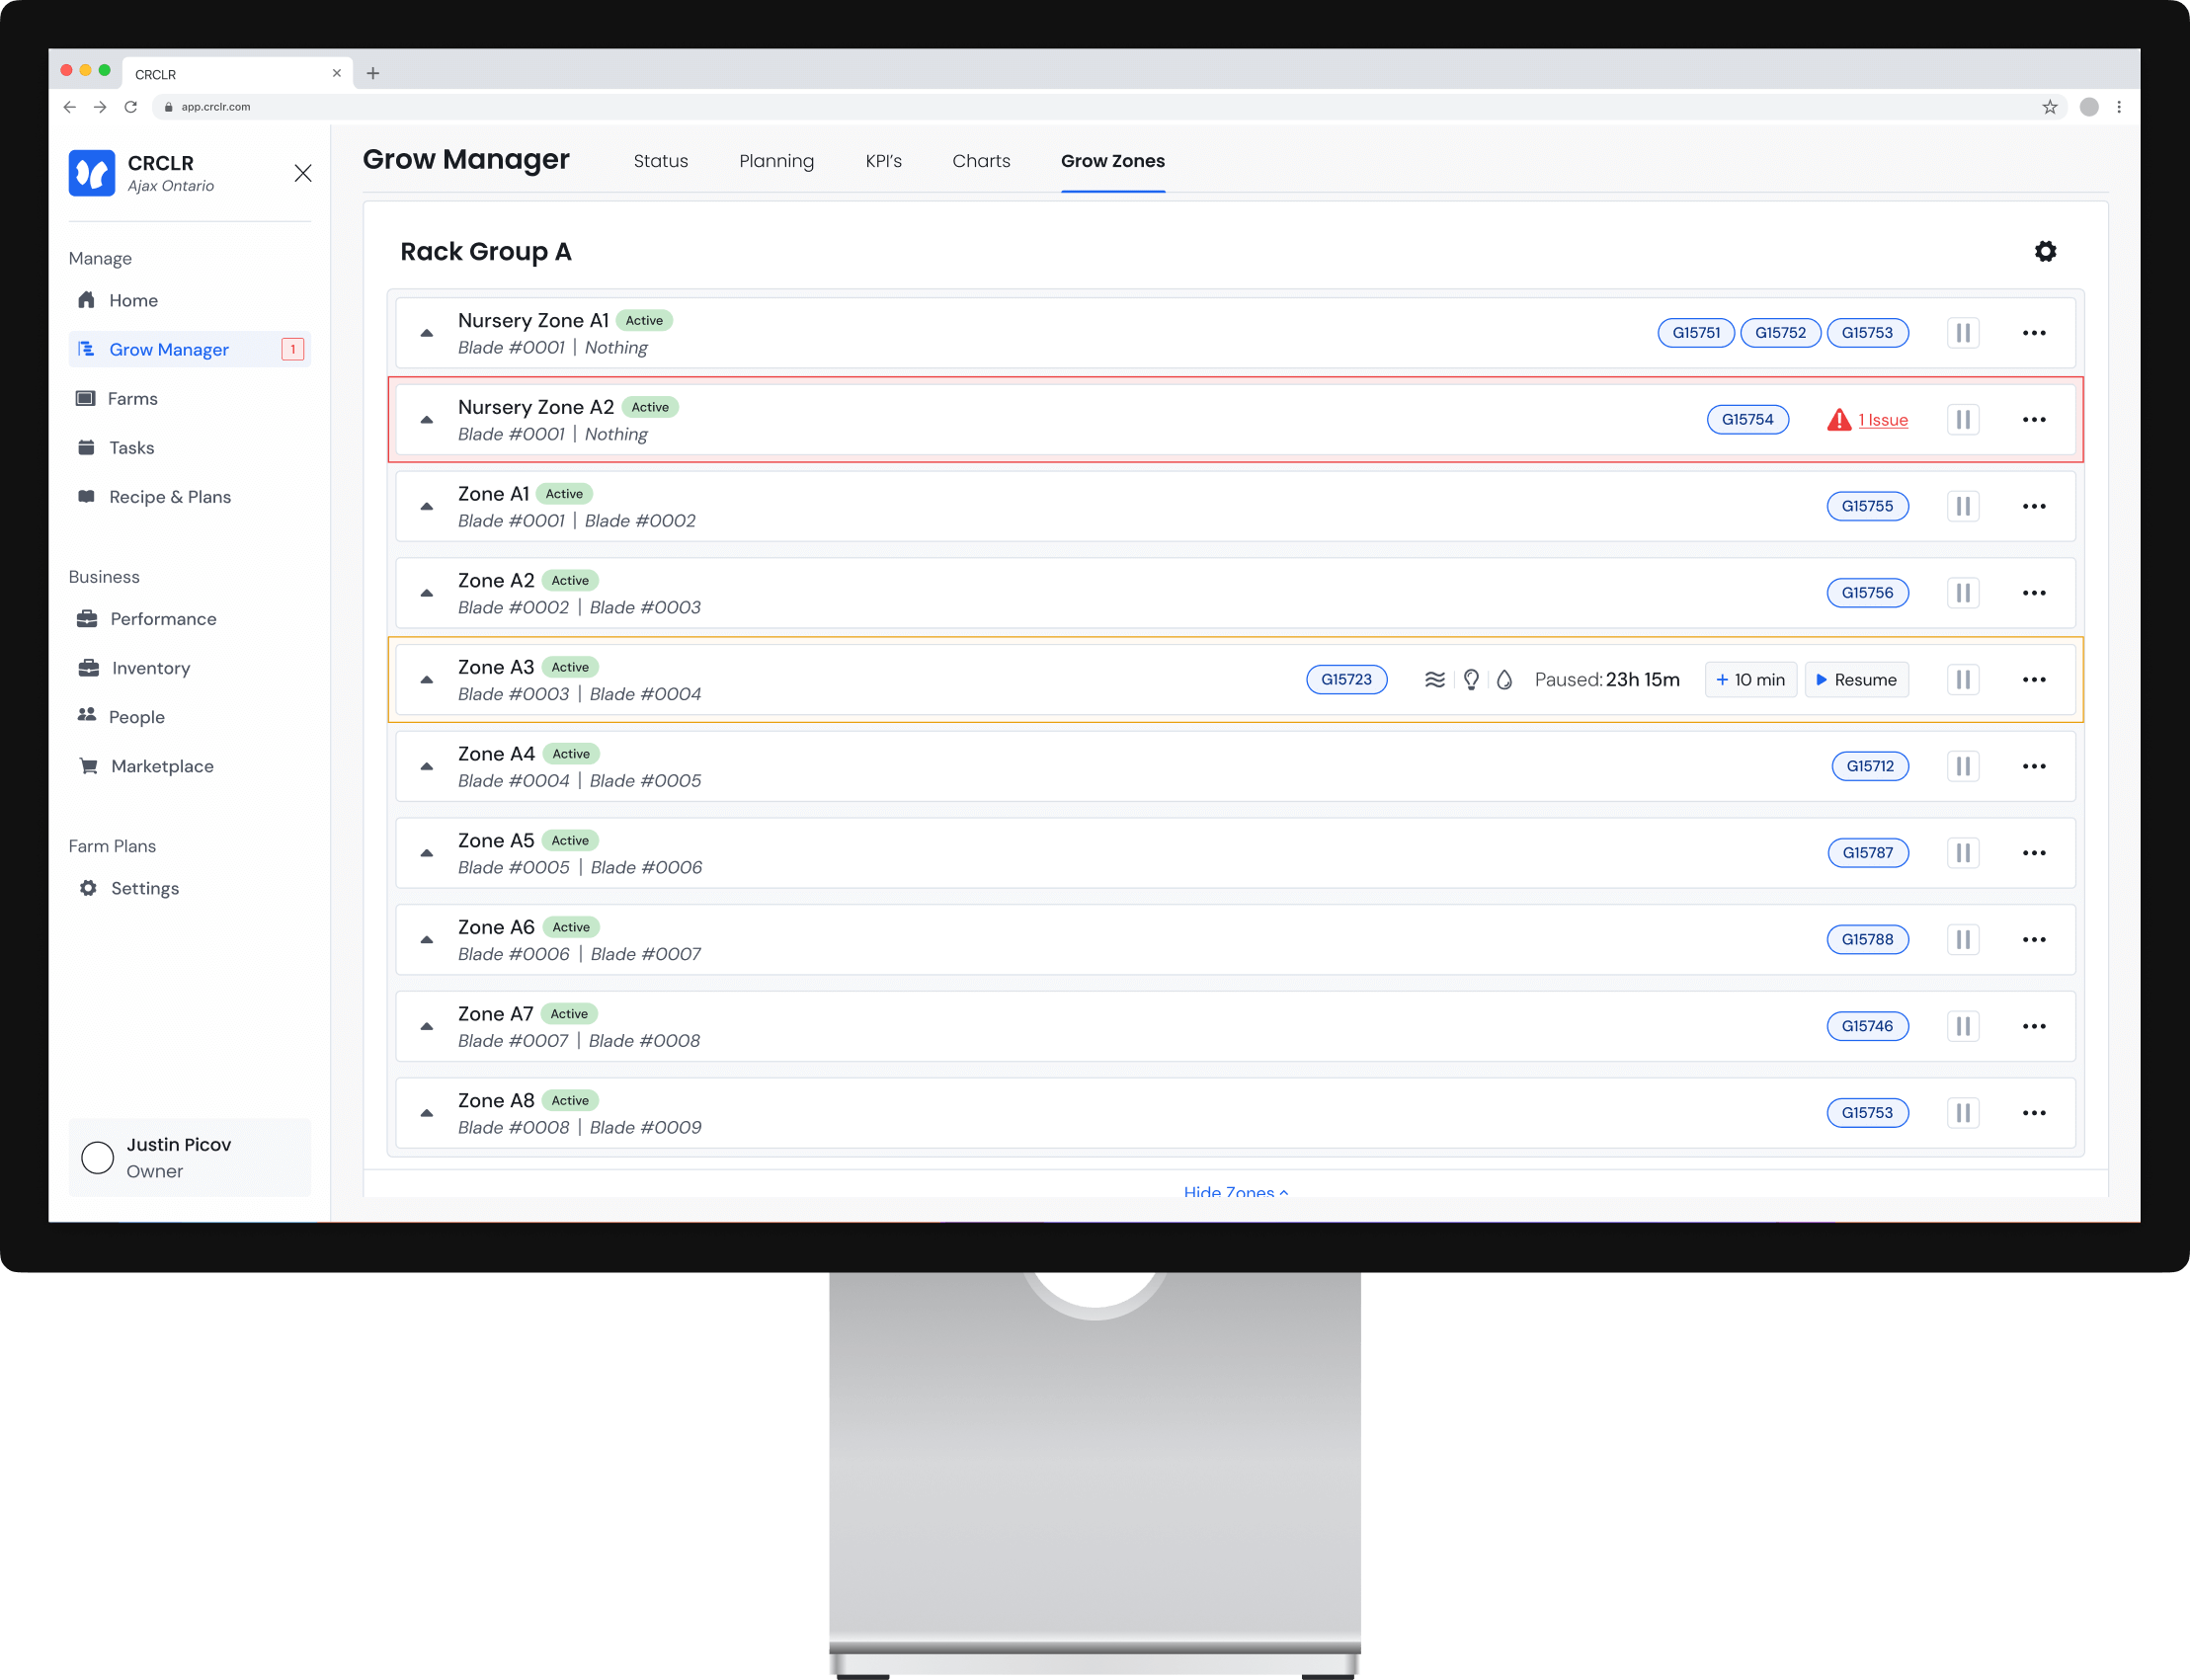
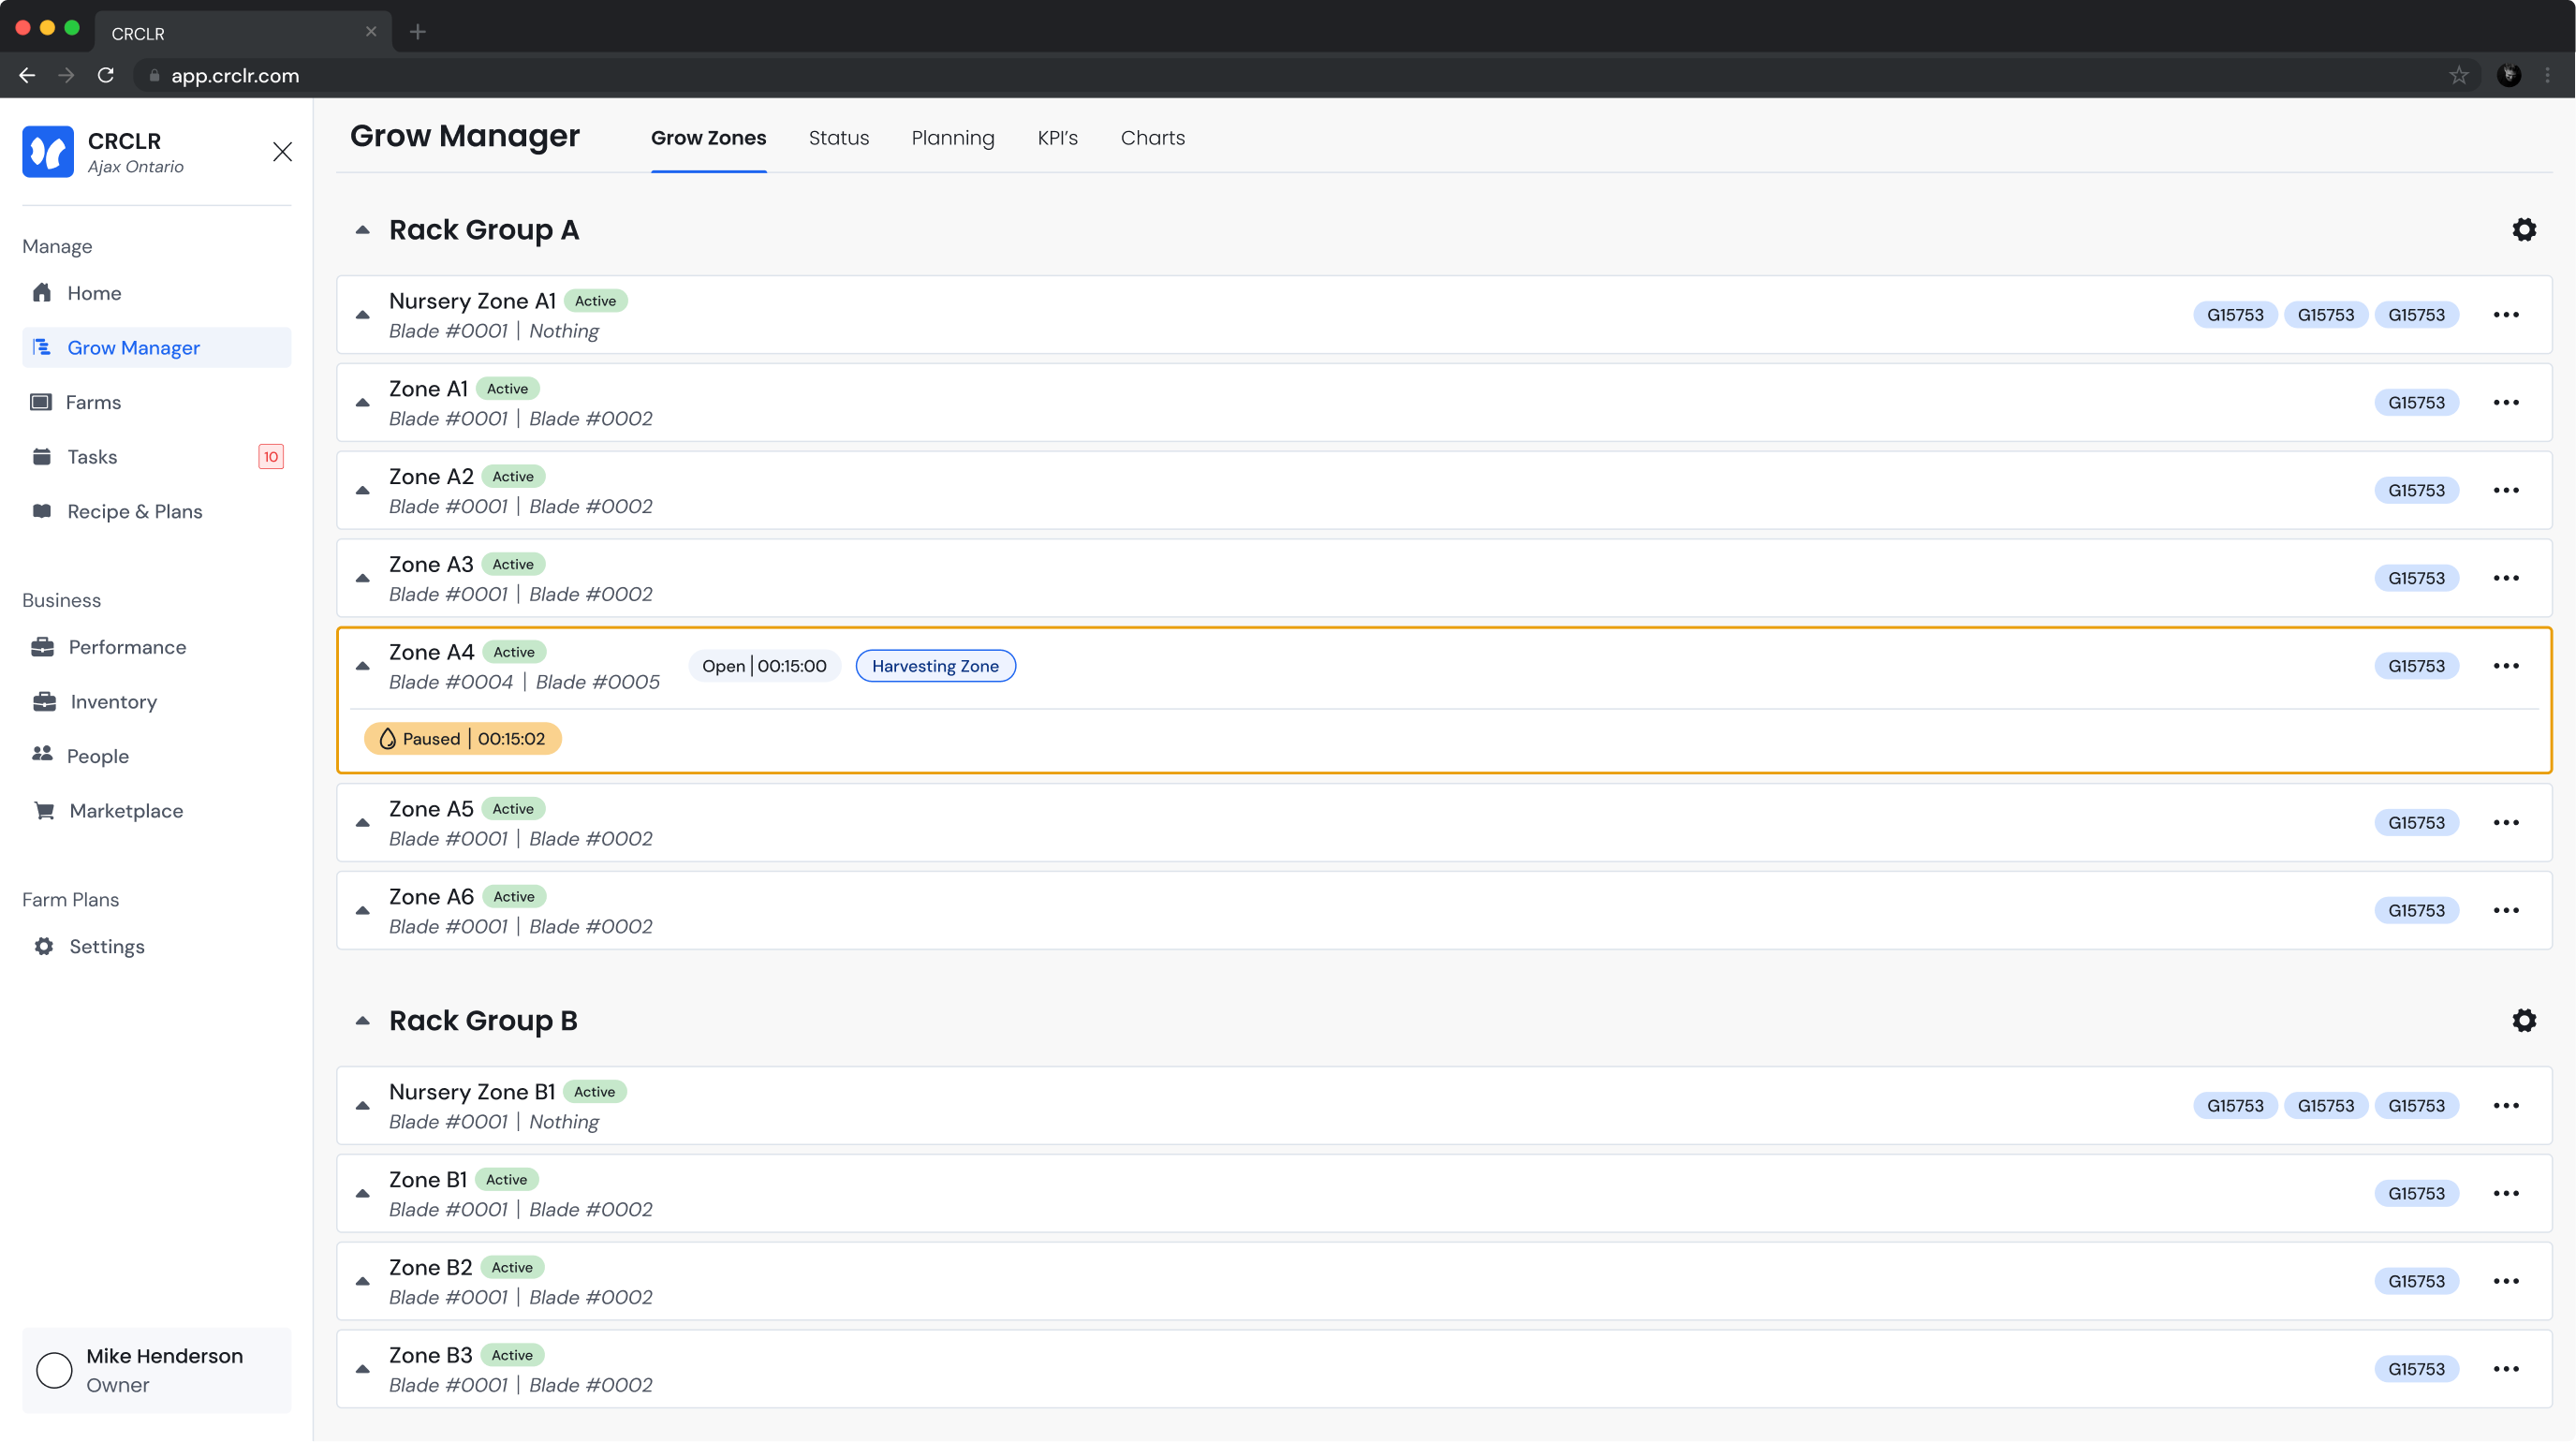
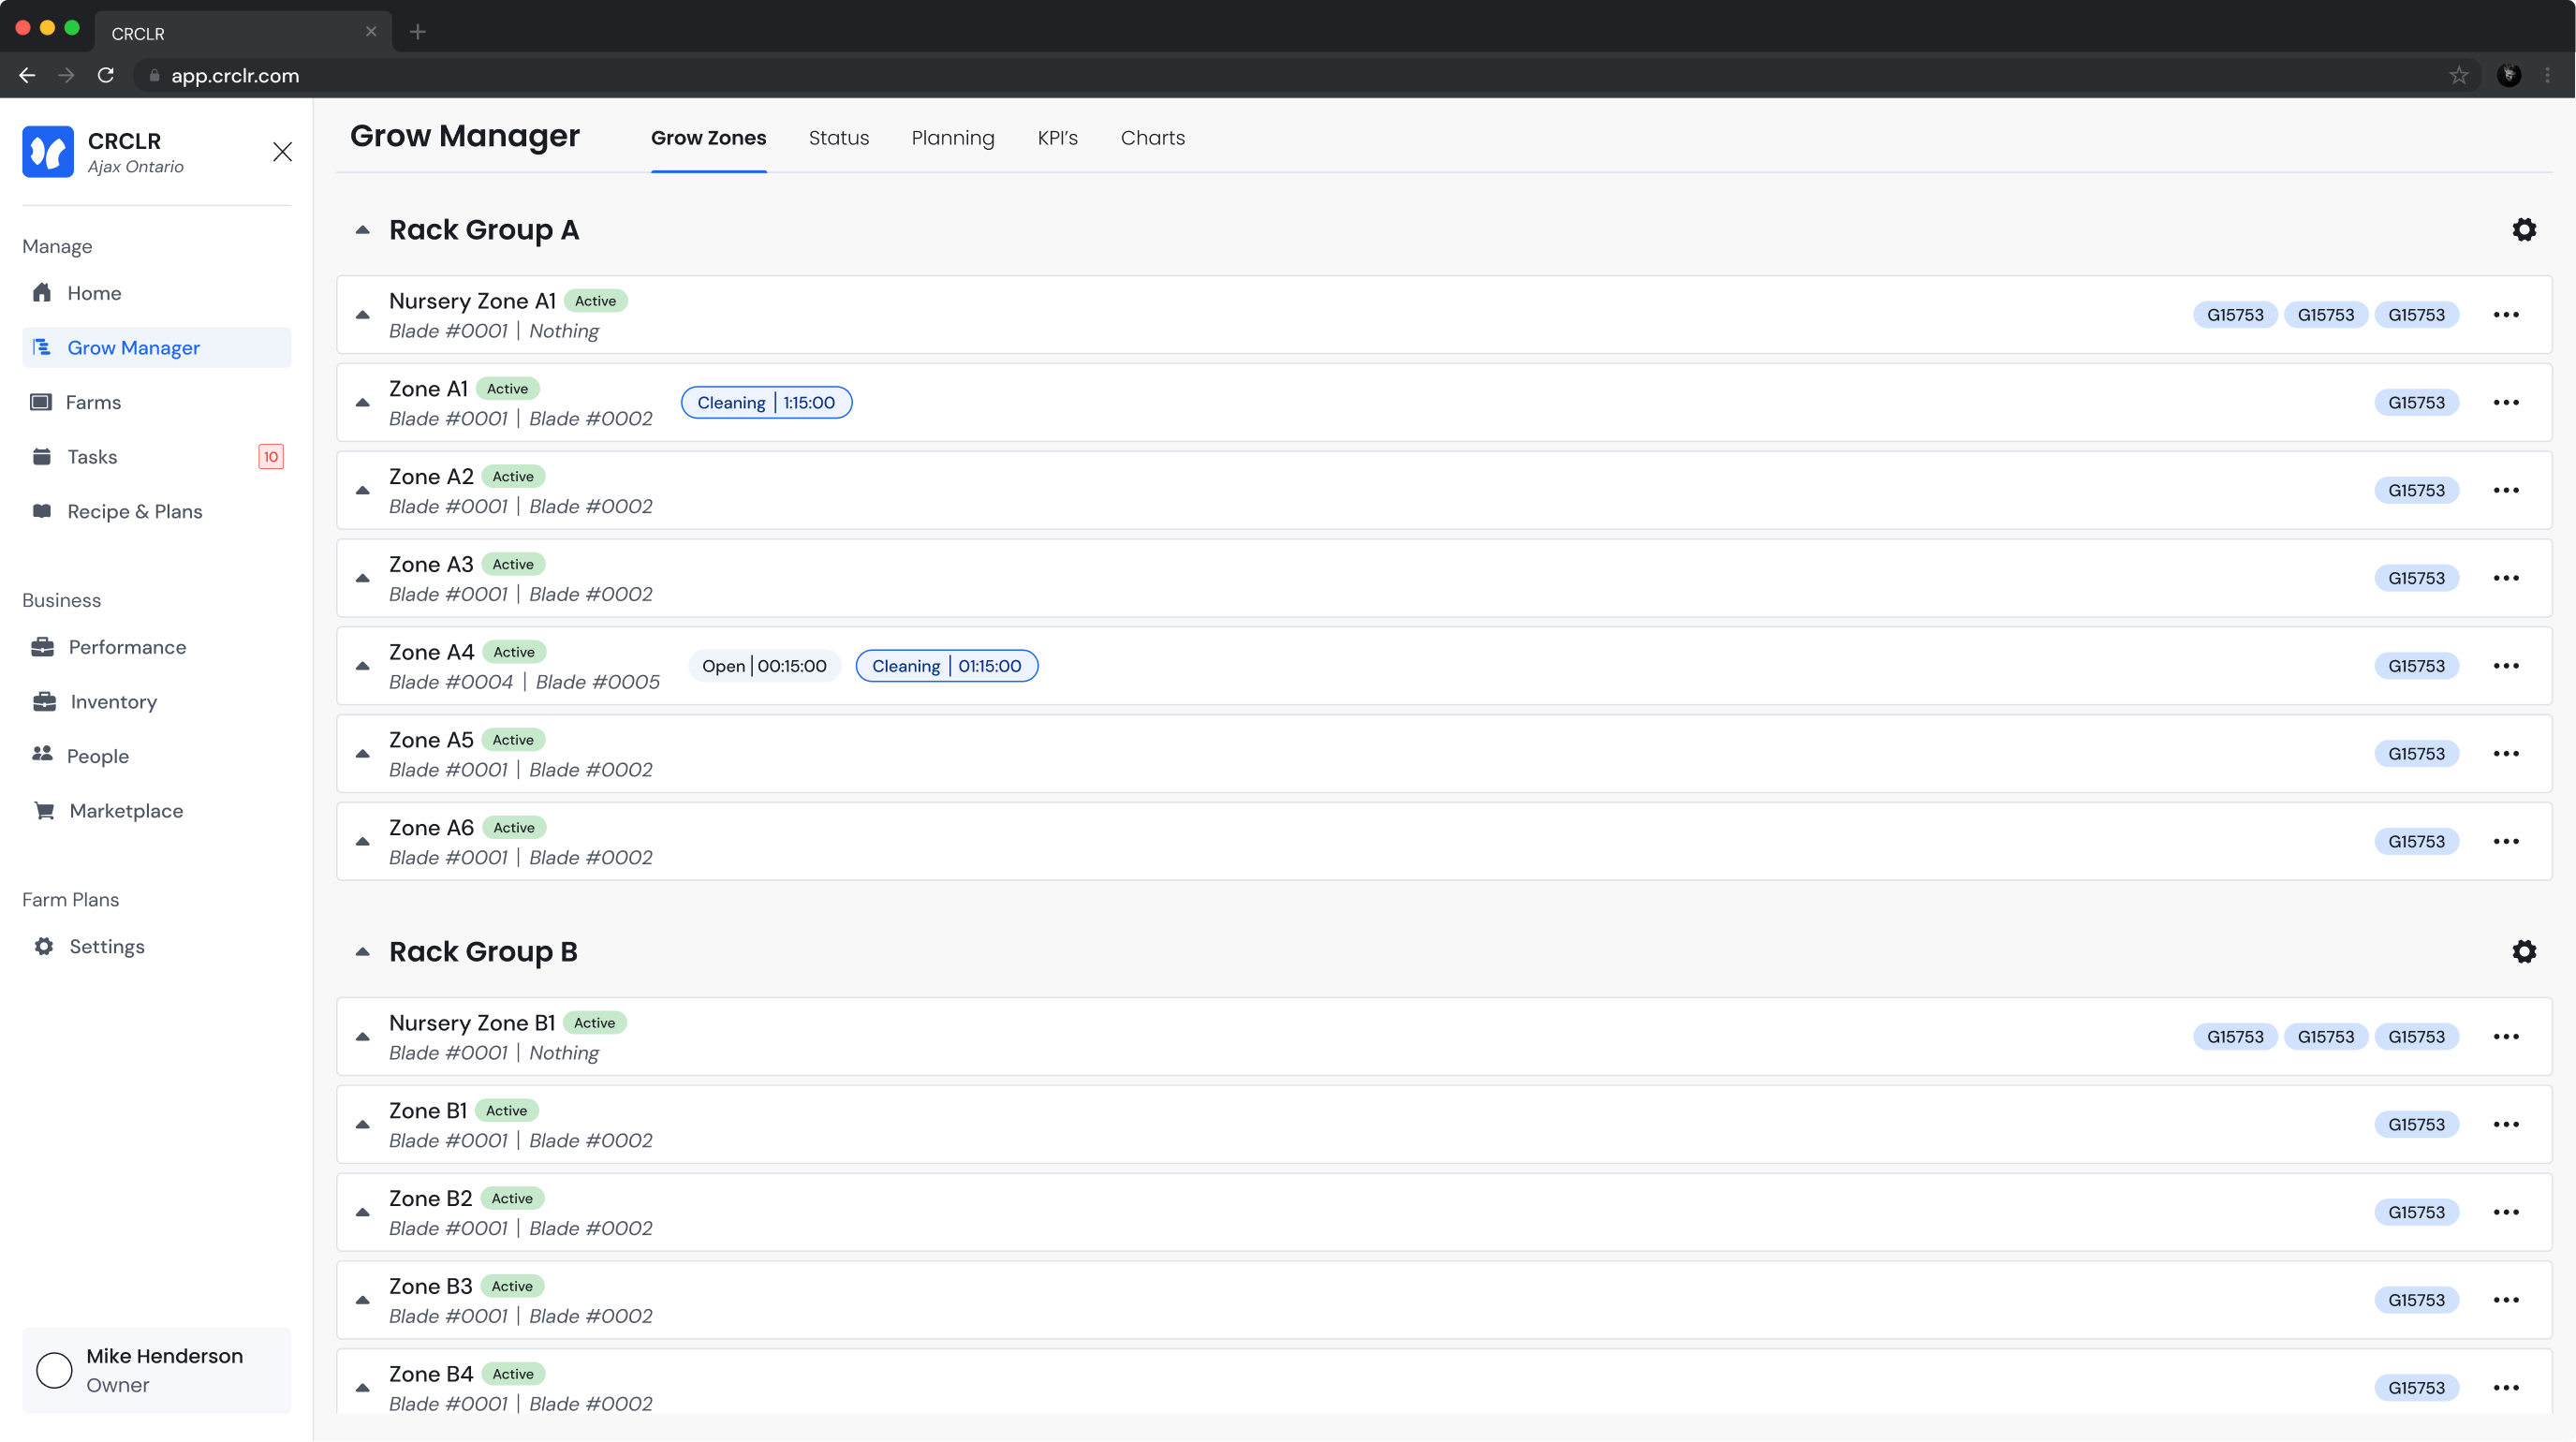
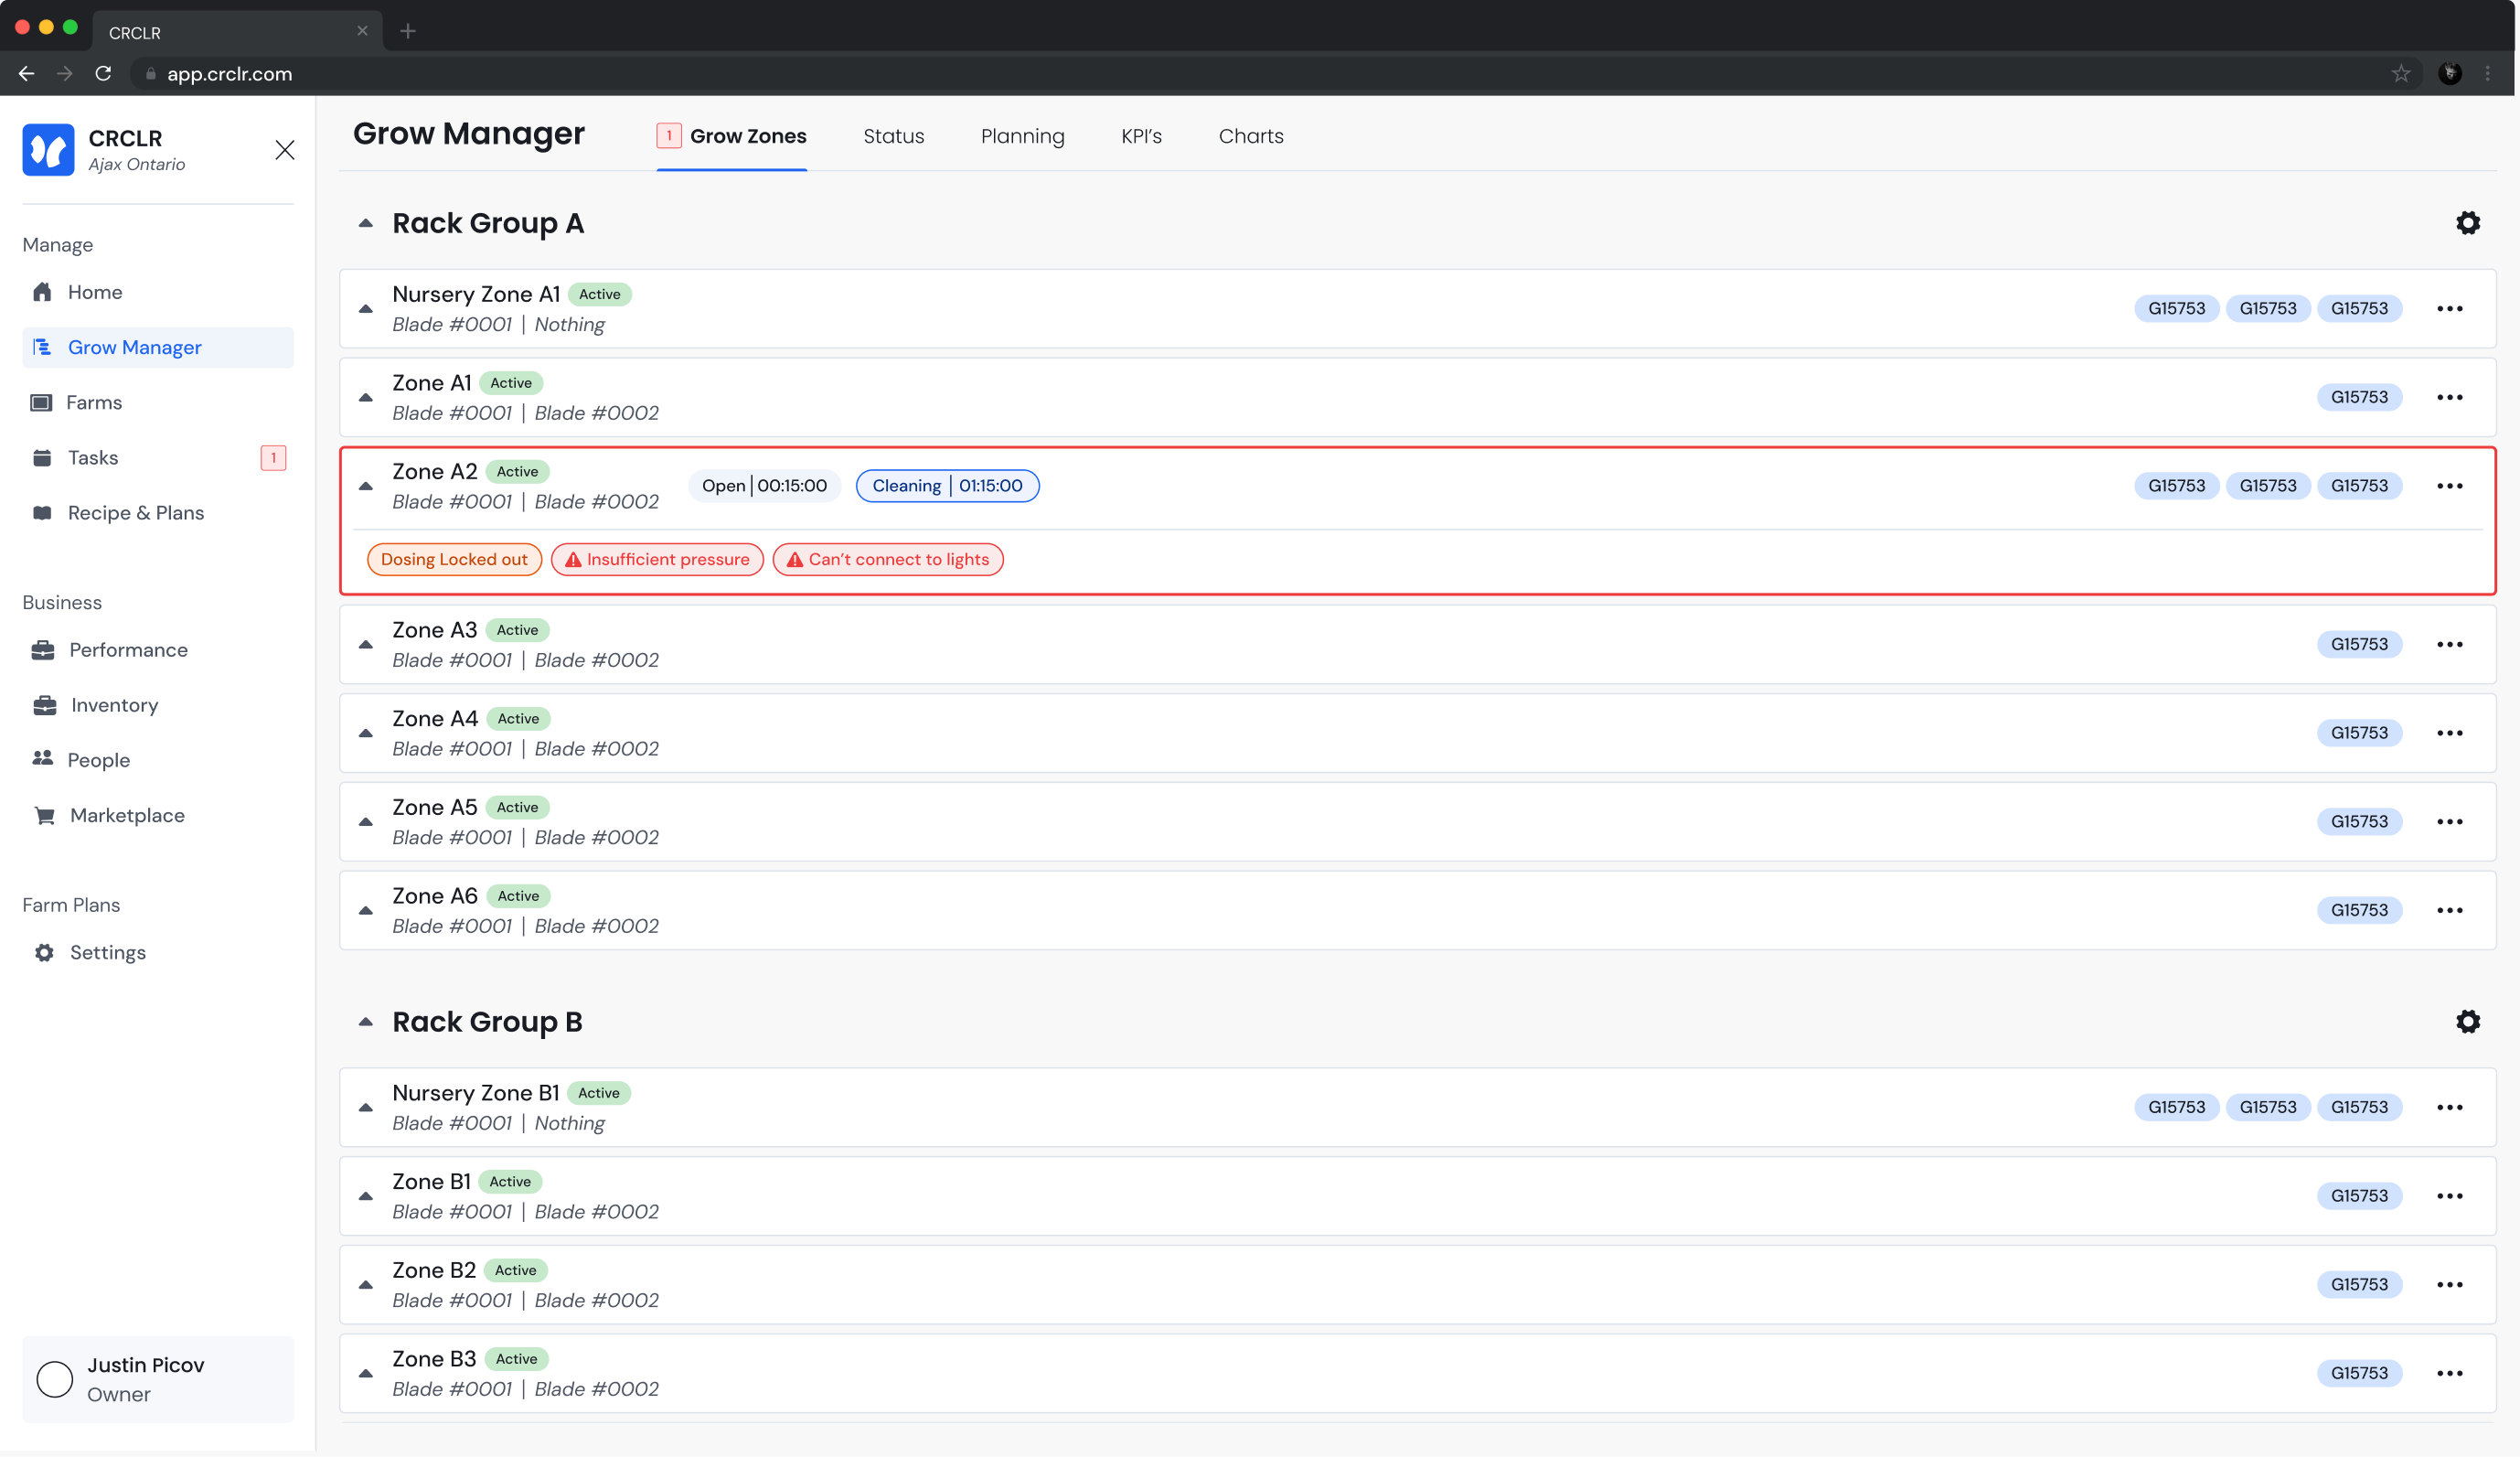
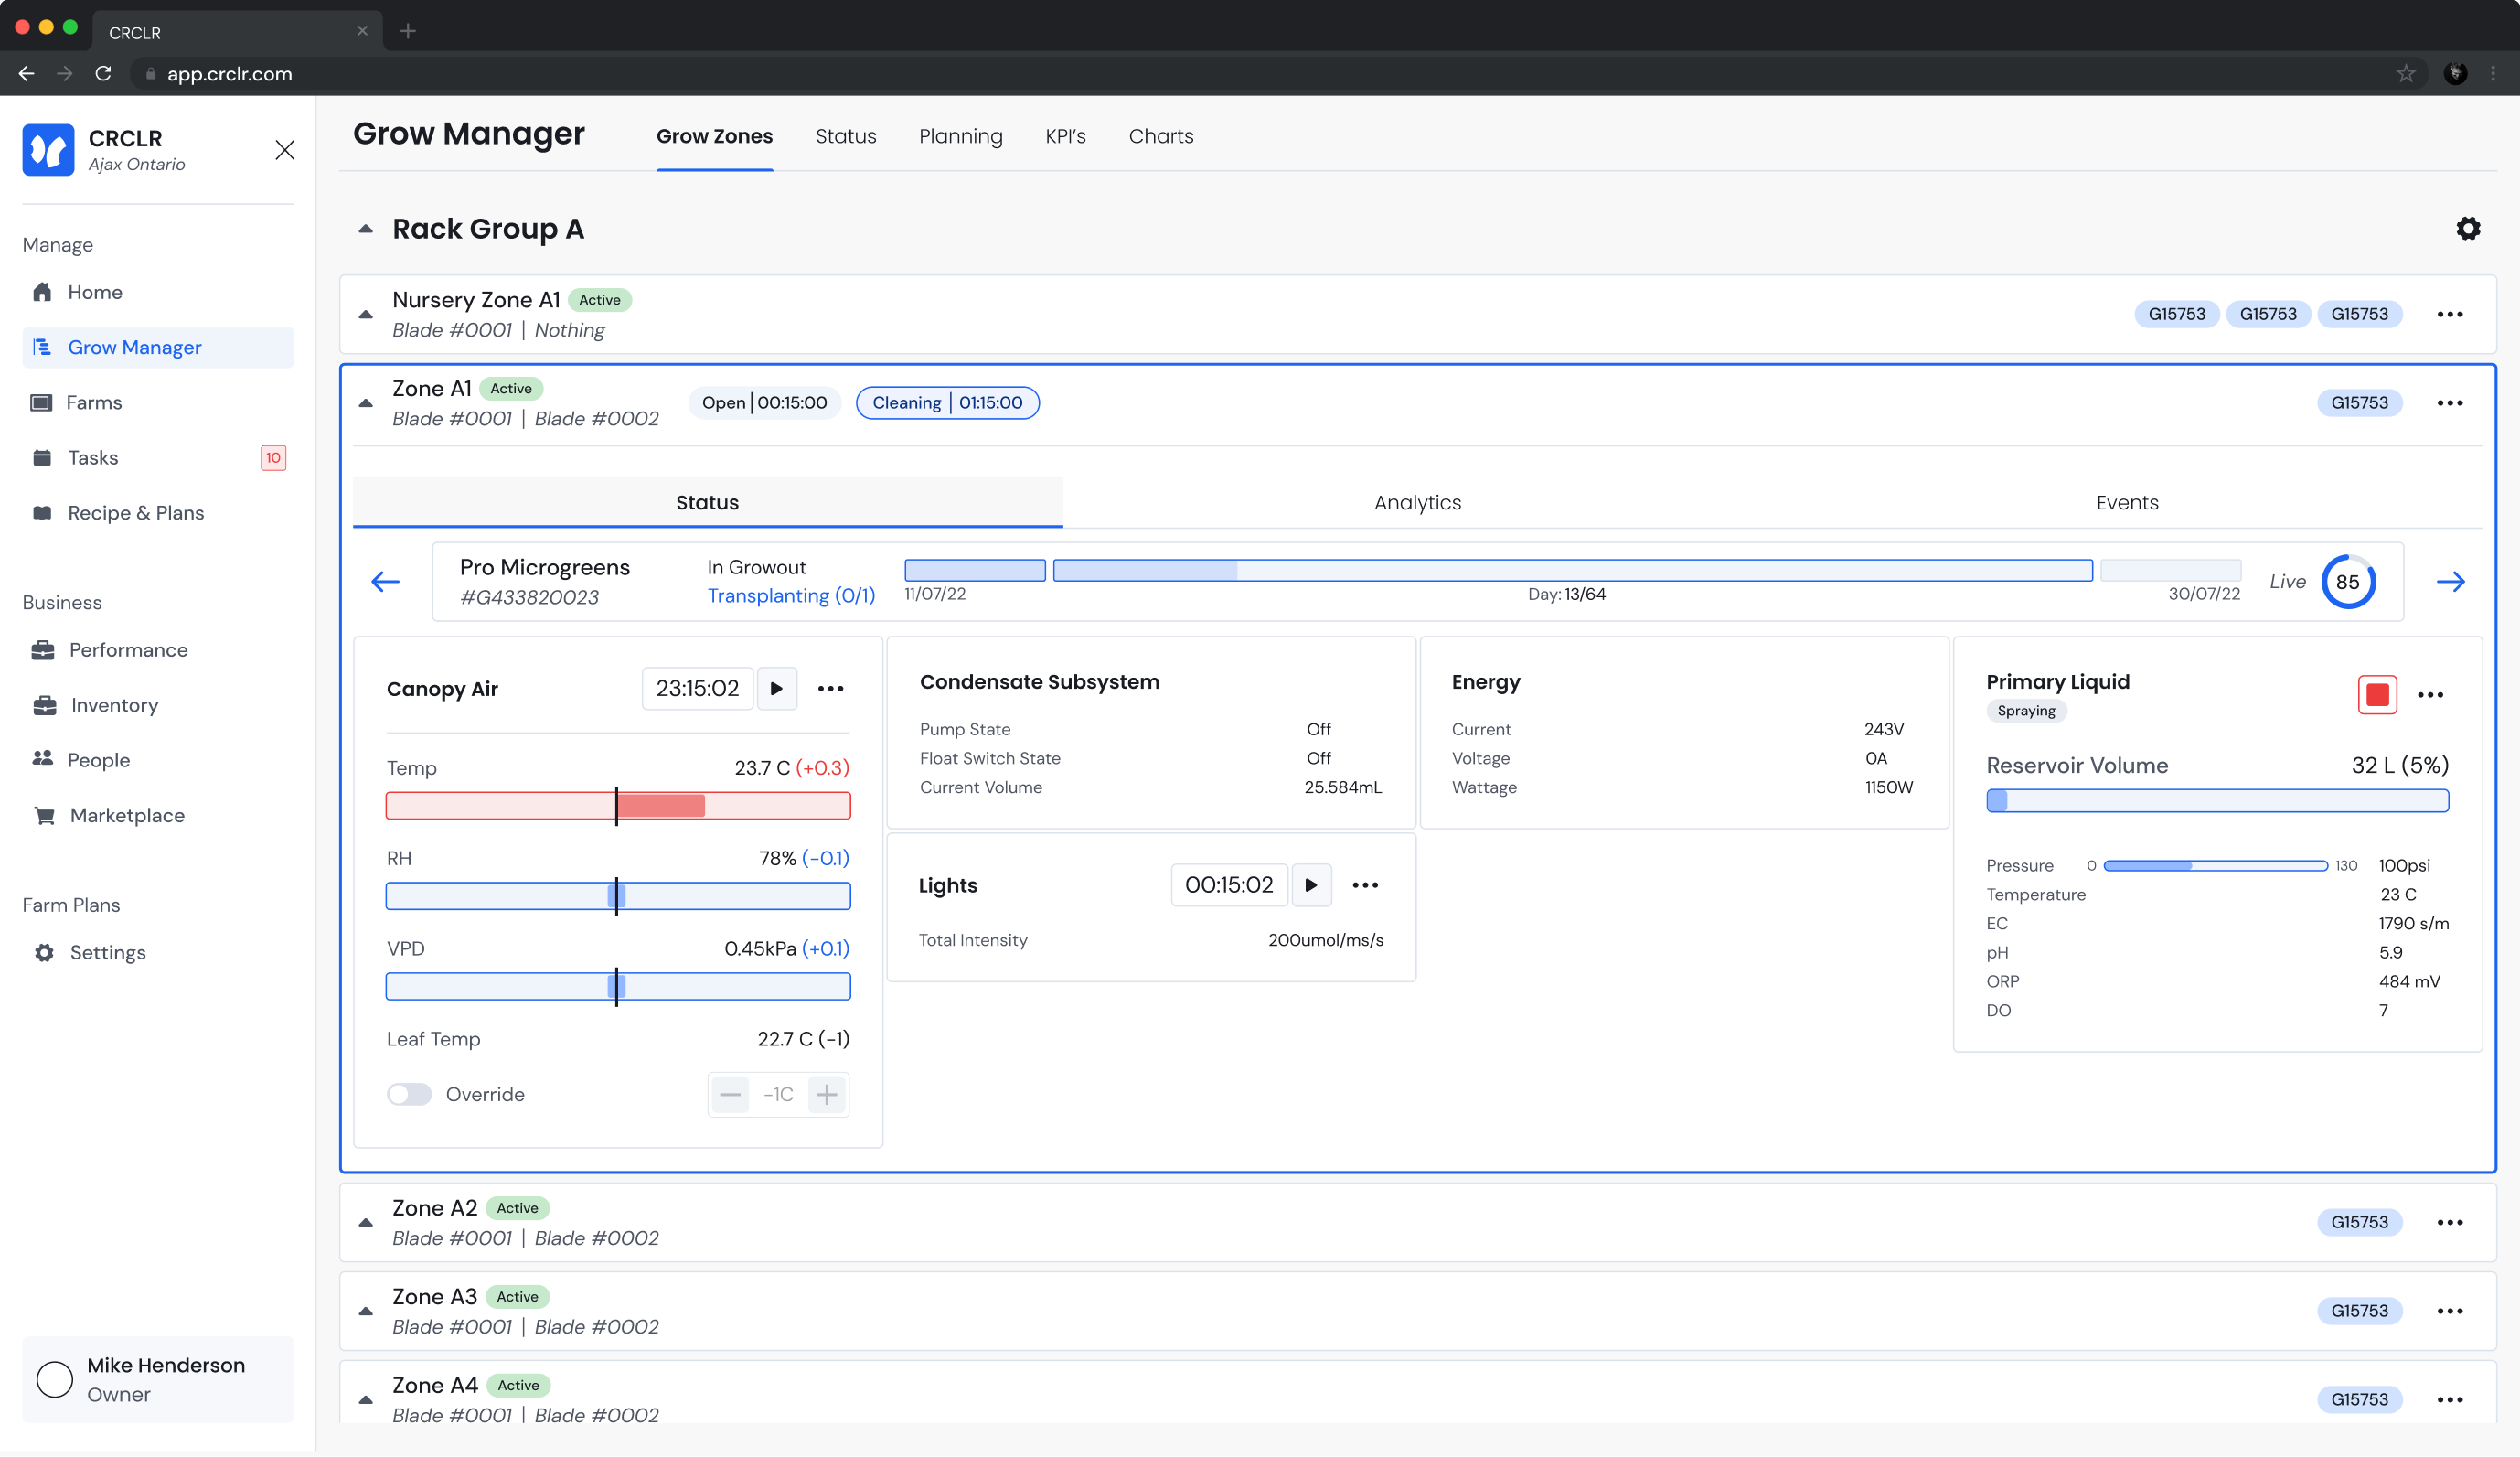
The grow zones page shows a vertical list of zone cells all contained within a "rack group". These cells show relevant active zone data the zone's name, related rack names & active grows within the zone. If something important is occurring in the zone, there will be coloured indicators along with buttons and hyperlinks.
Design
Can I find specific live numbers?
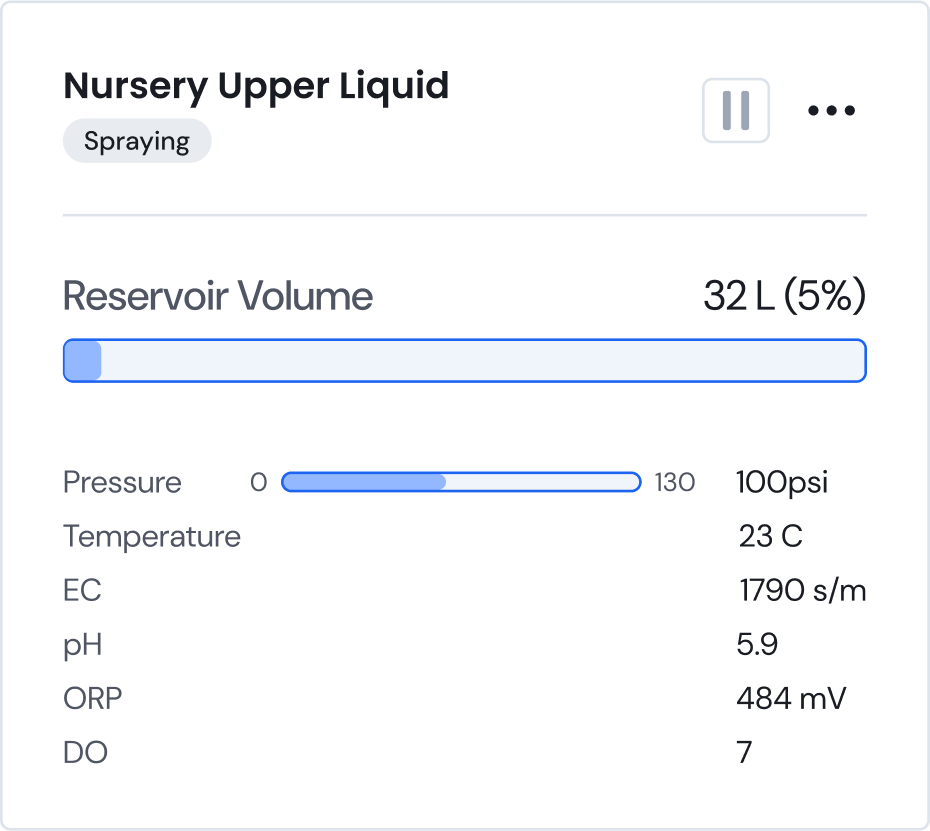
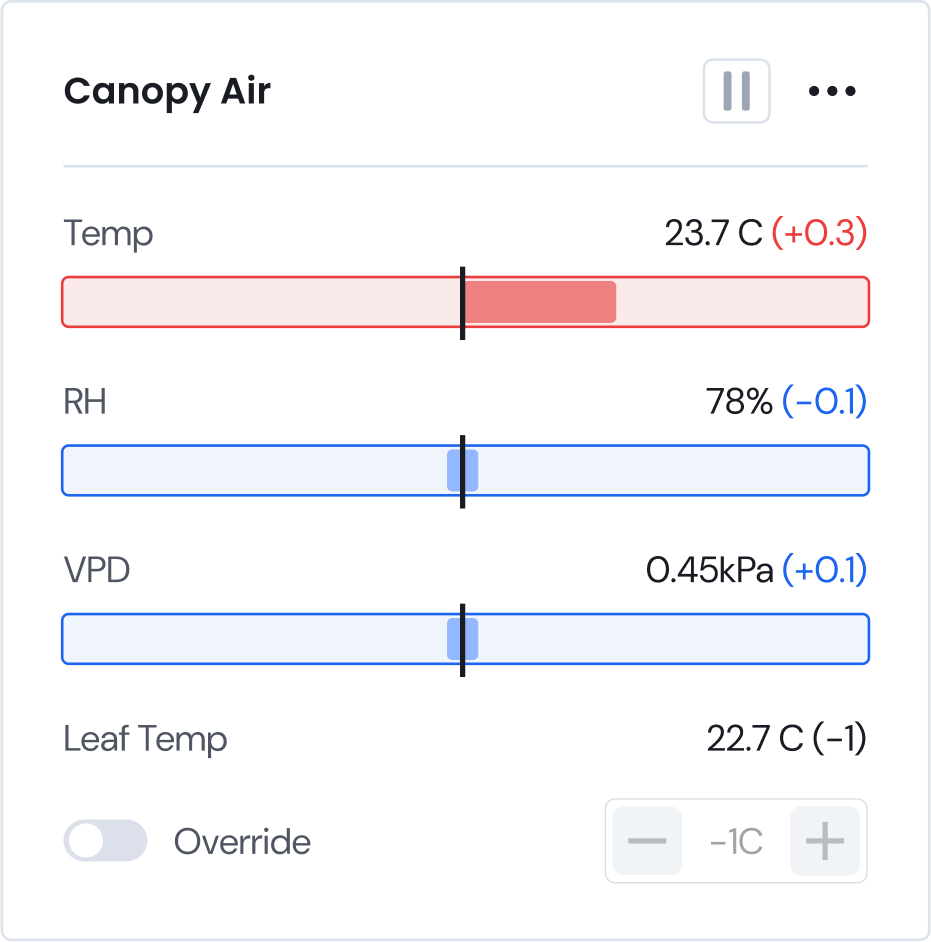
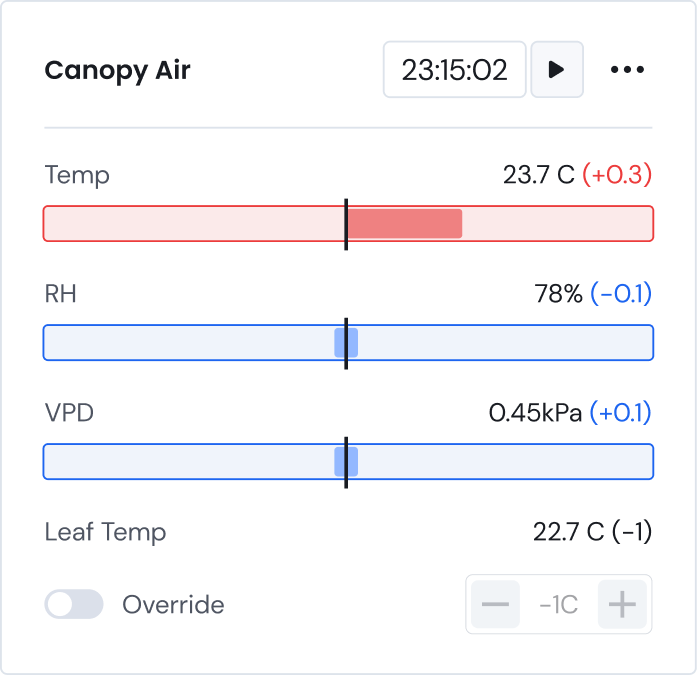
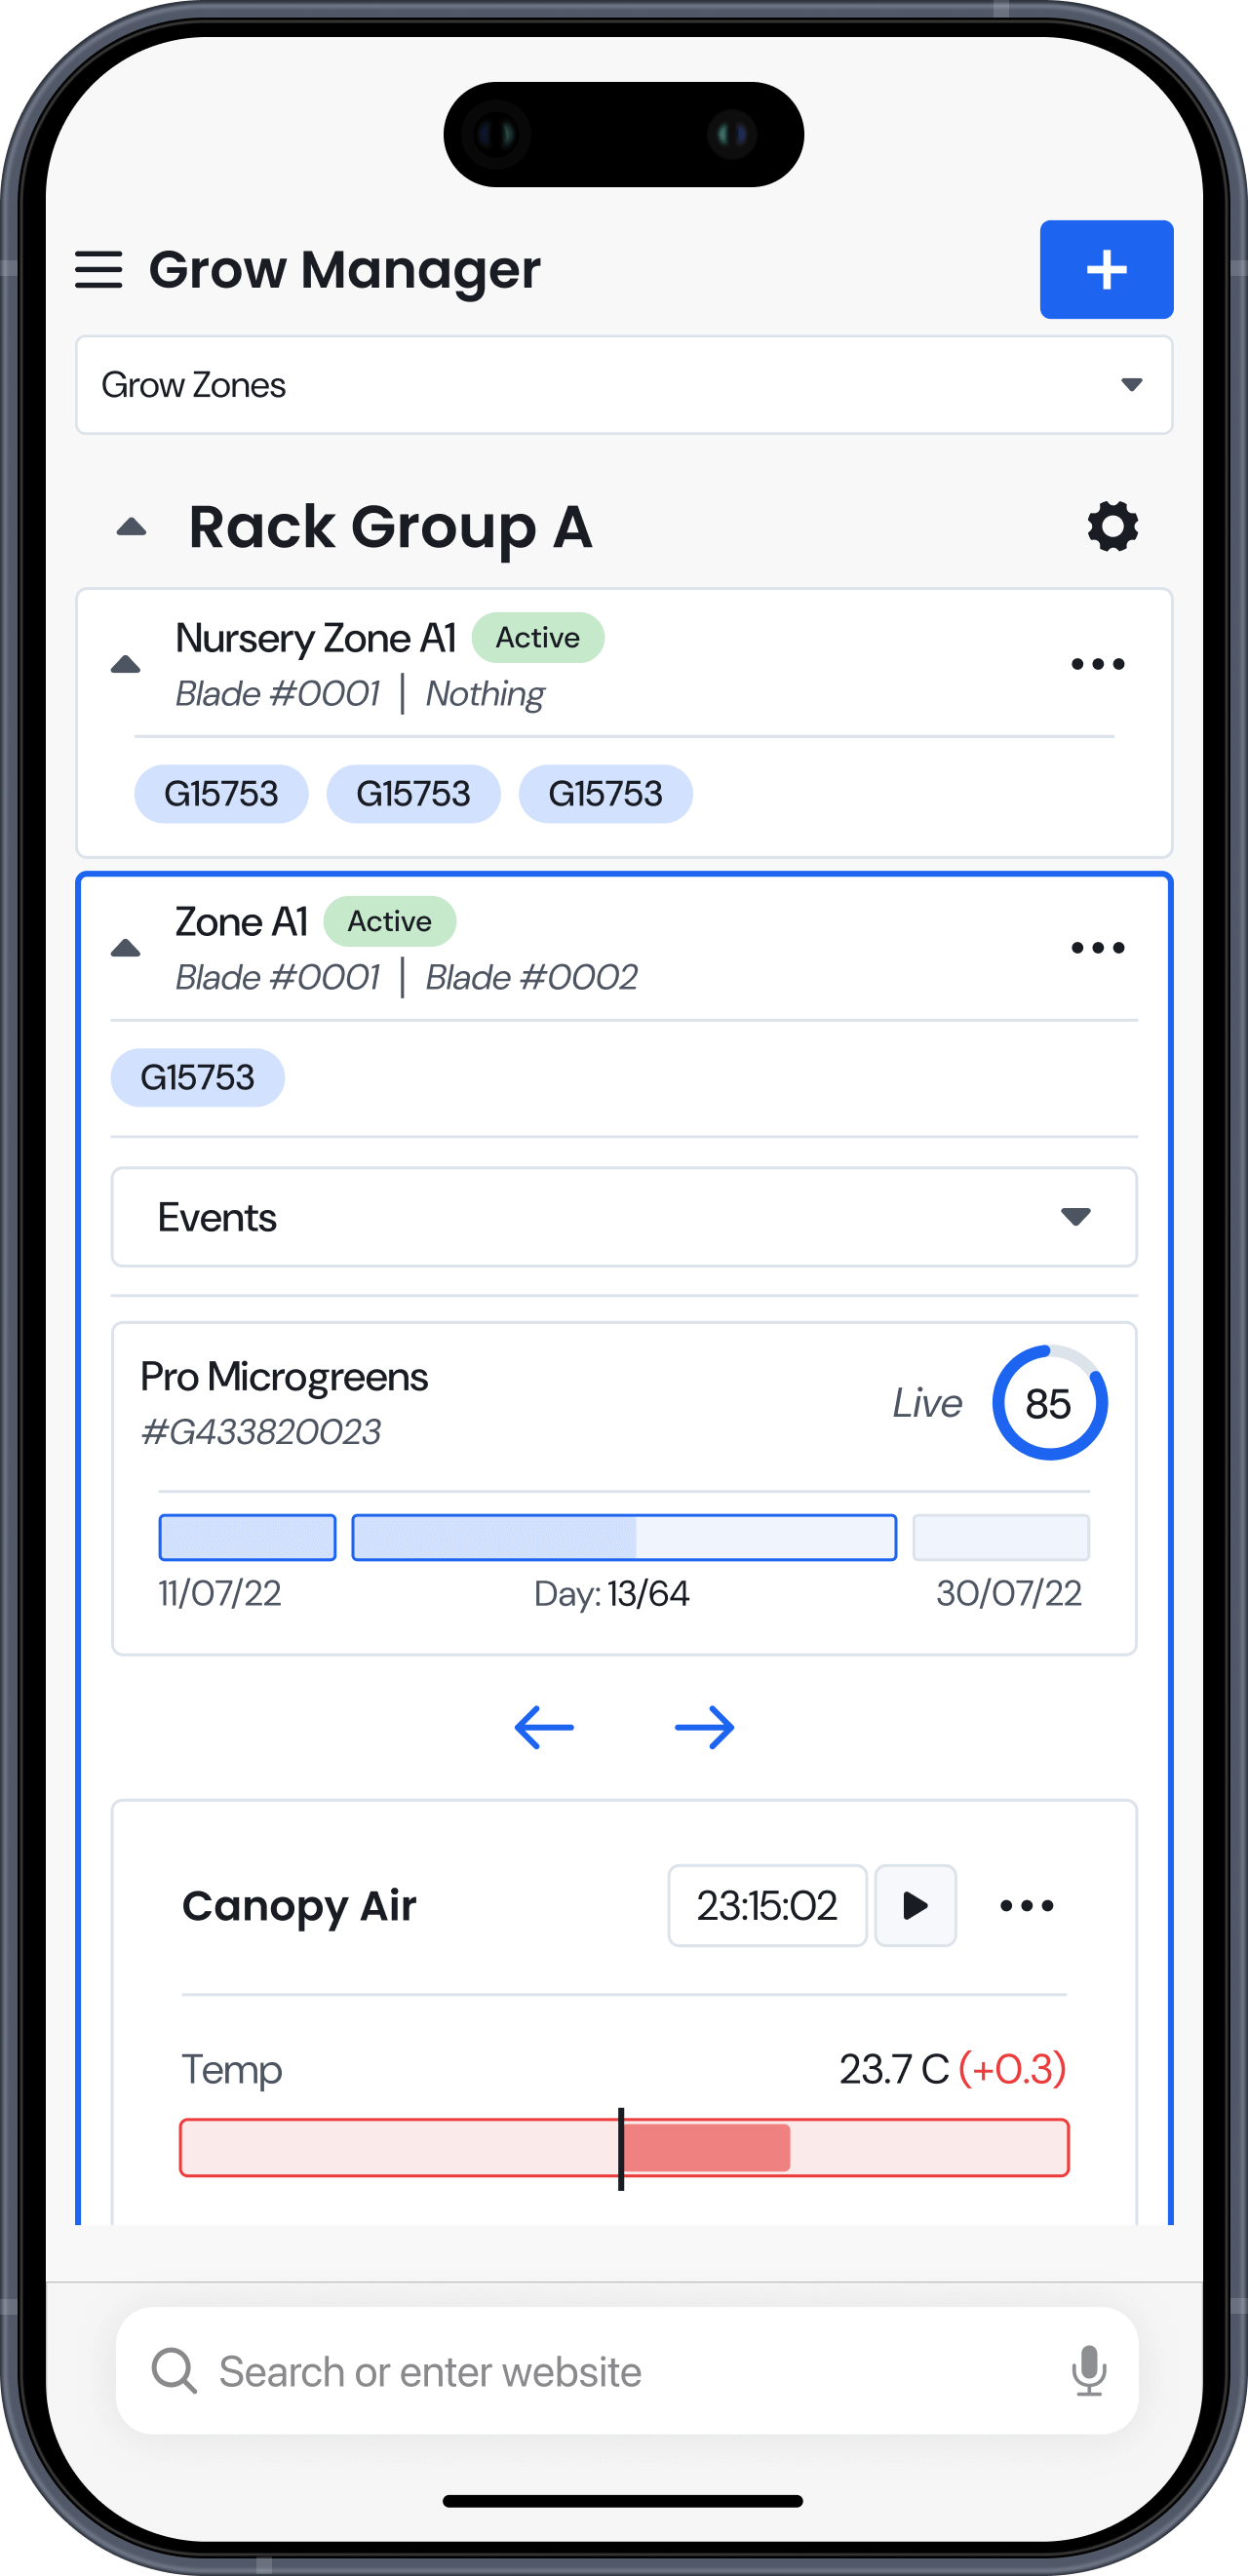
Clicking a cell will open up more zone info organized under status, analytics & events tabs. The zone status, shows how accurately a zone is responding to ate current recipe. All relevant variables are shown visually in an organized widgets along with colourful bards when relevant.
Reservoir widgets show the current reservoir volume as well as values related to the water.
The setpoint widgets show the current variable value, as well as how far off it currently is.
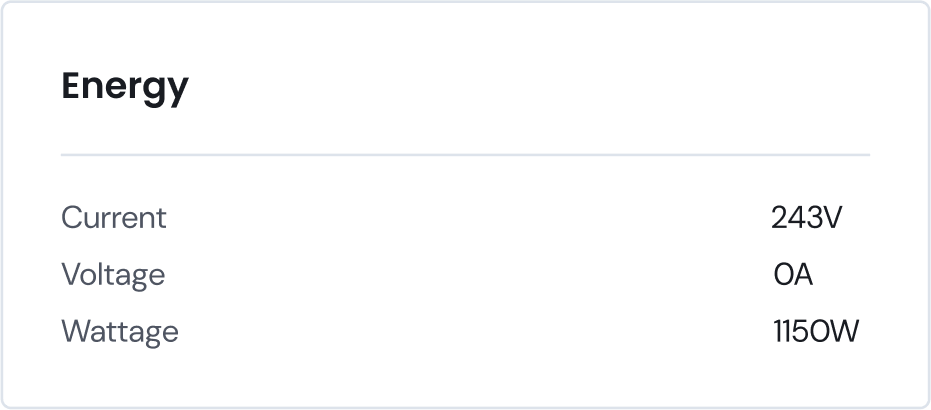
A data widget shows a group of values in the simplest way possible, either a value or a state.
Design
How can I monitor what happened yesterday
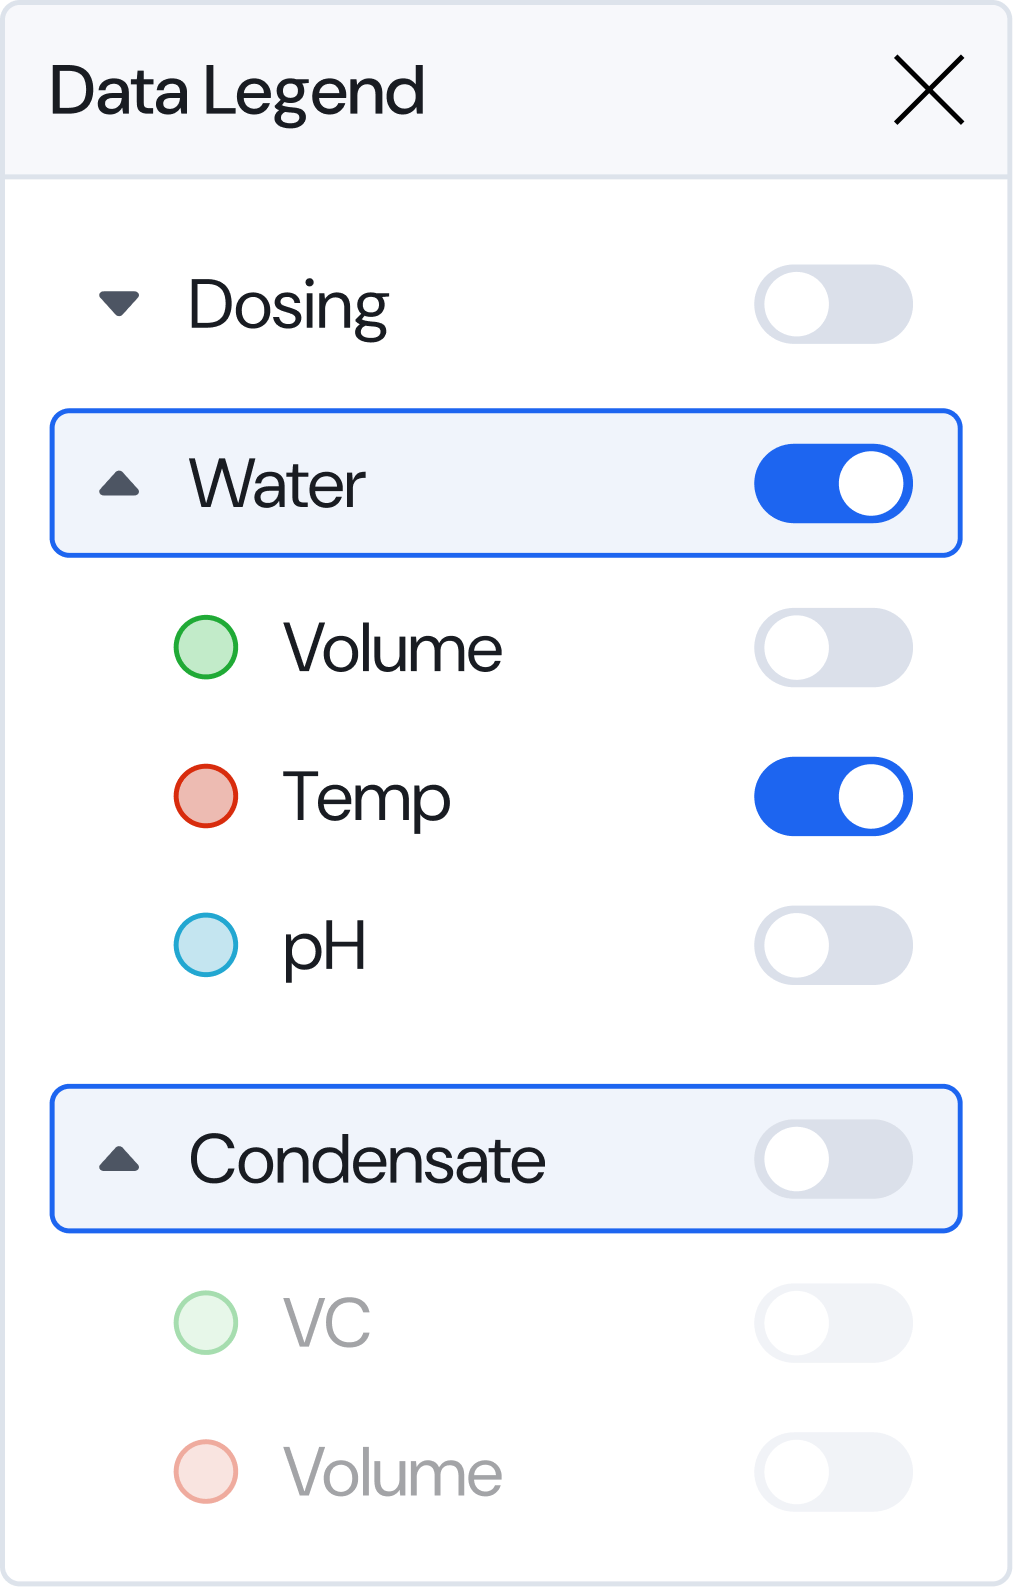
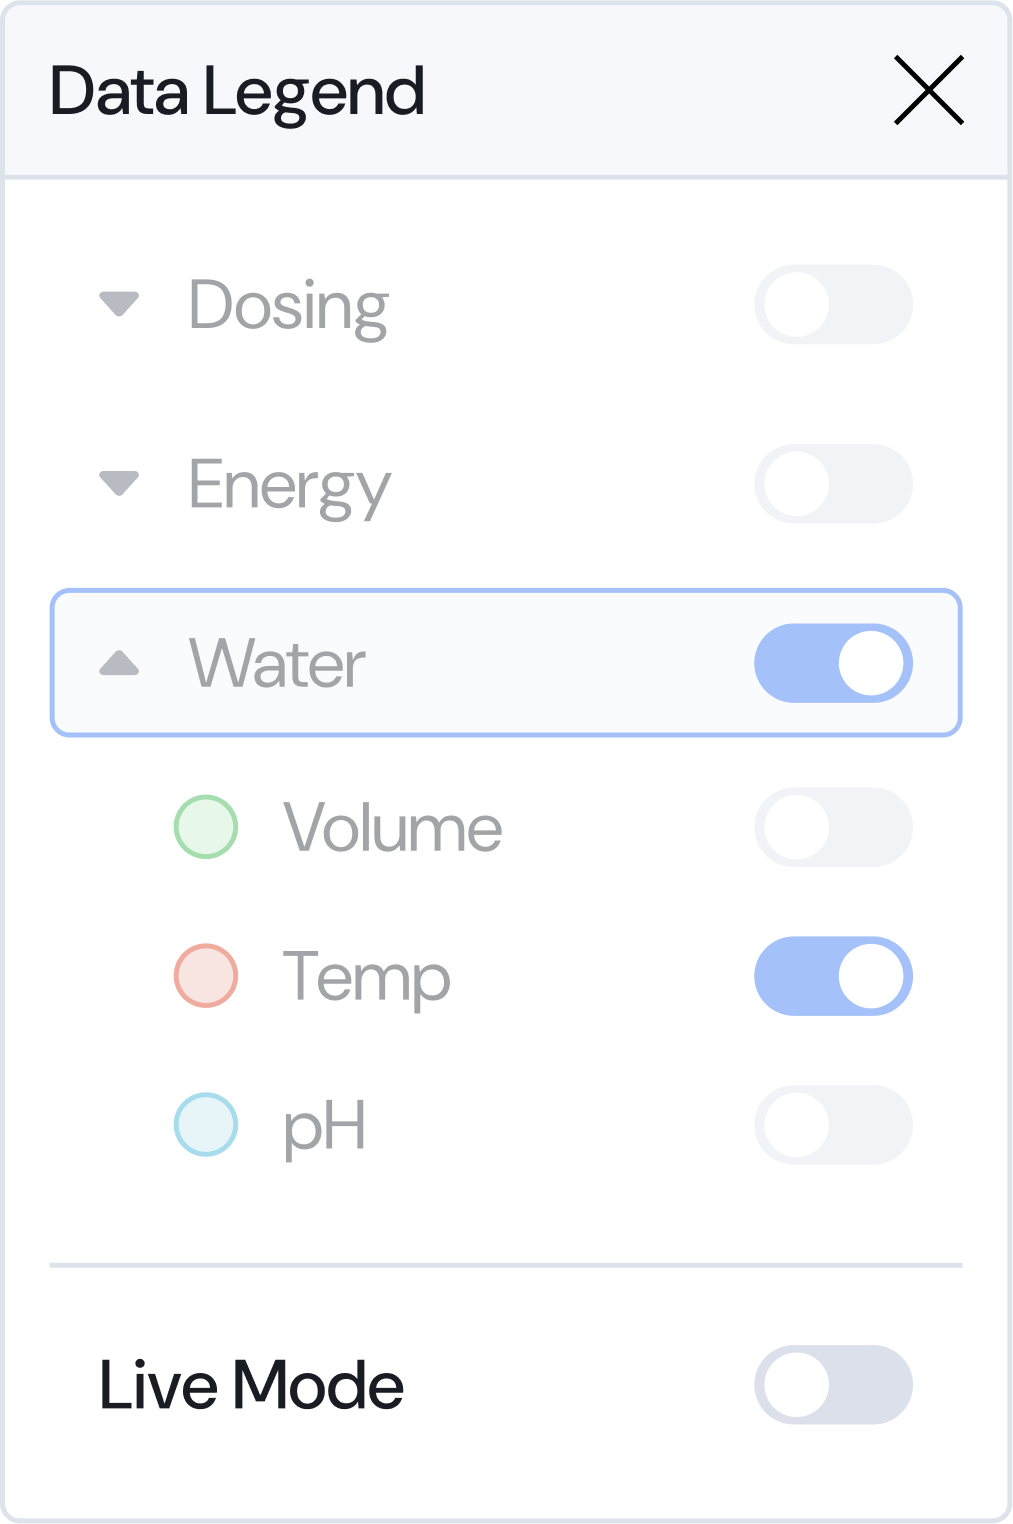
The analytics tab allows users to check back in time at how a rack was operating at a specific time range. The graphed data can be zoomed or panned to view a specific time range, allowing users to check for irregularities or issues they may have missed. Over 30 variables can be toggled on or off in the legend on the left of the graph.
Graphed Data
The analytics tab allows users to check back in time at how a rack was operating. This allows users to check for irregularities or issues they may have missed.
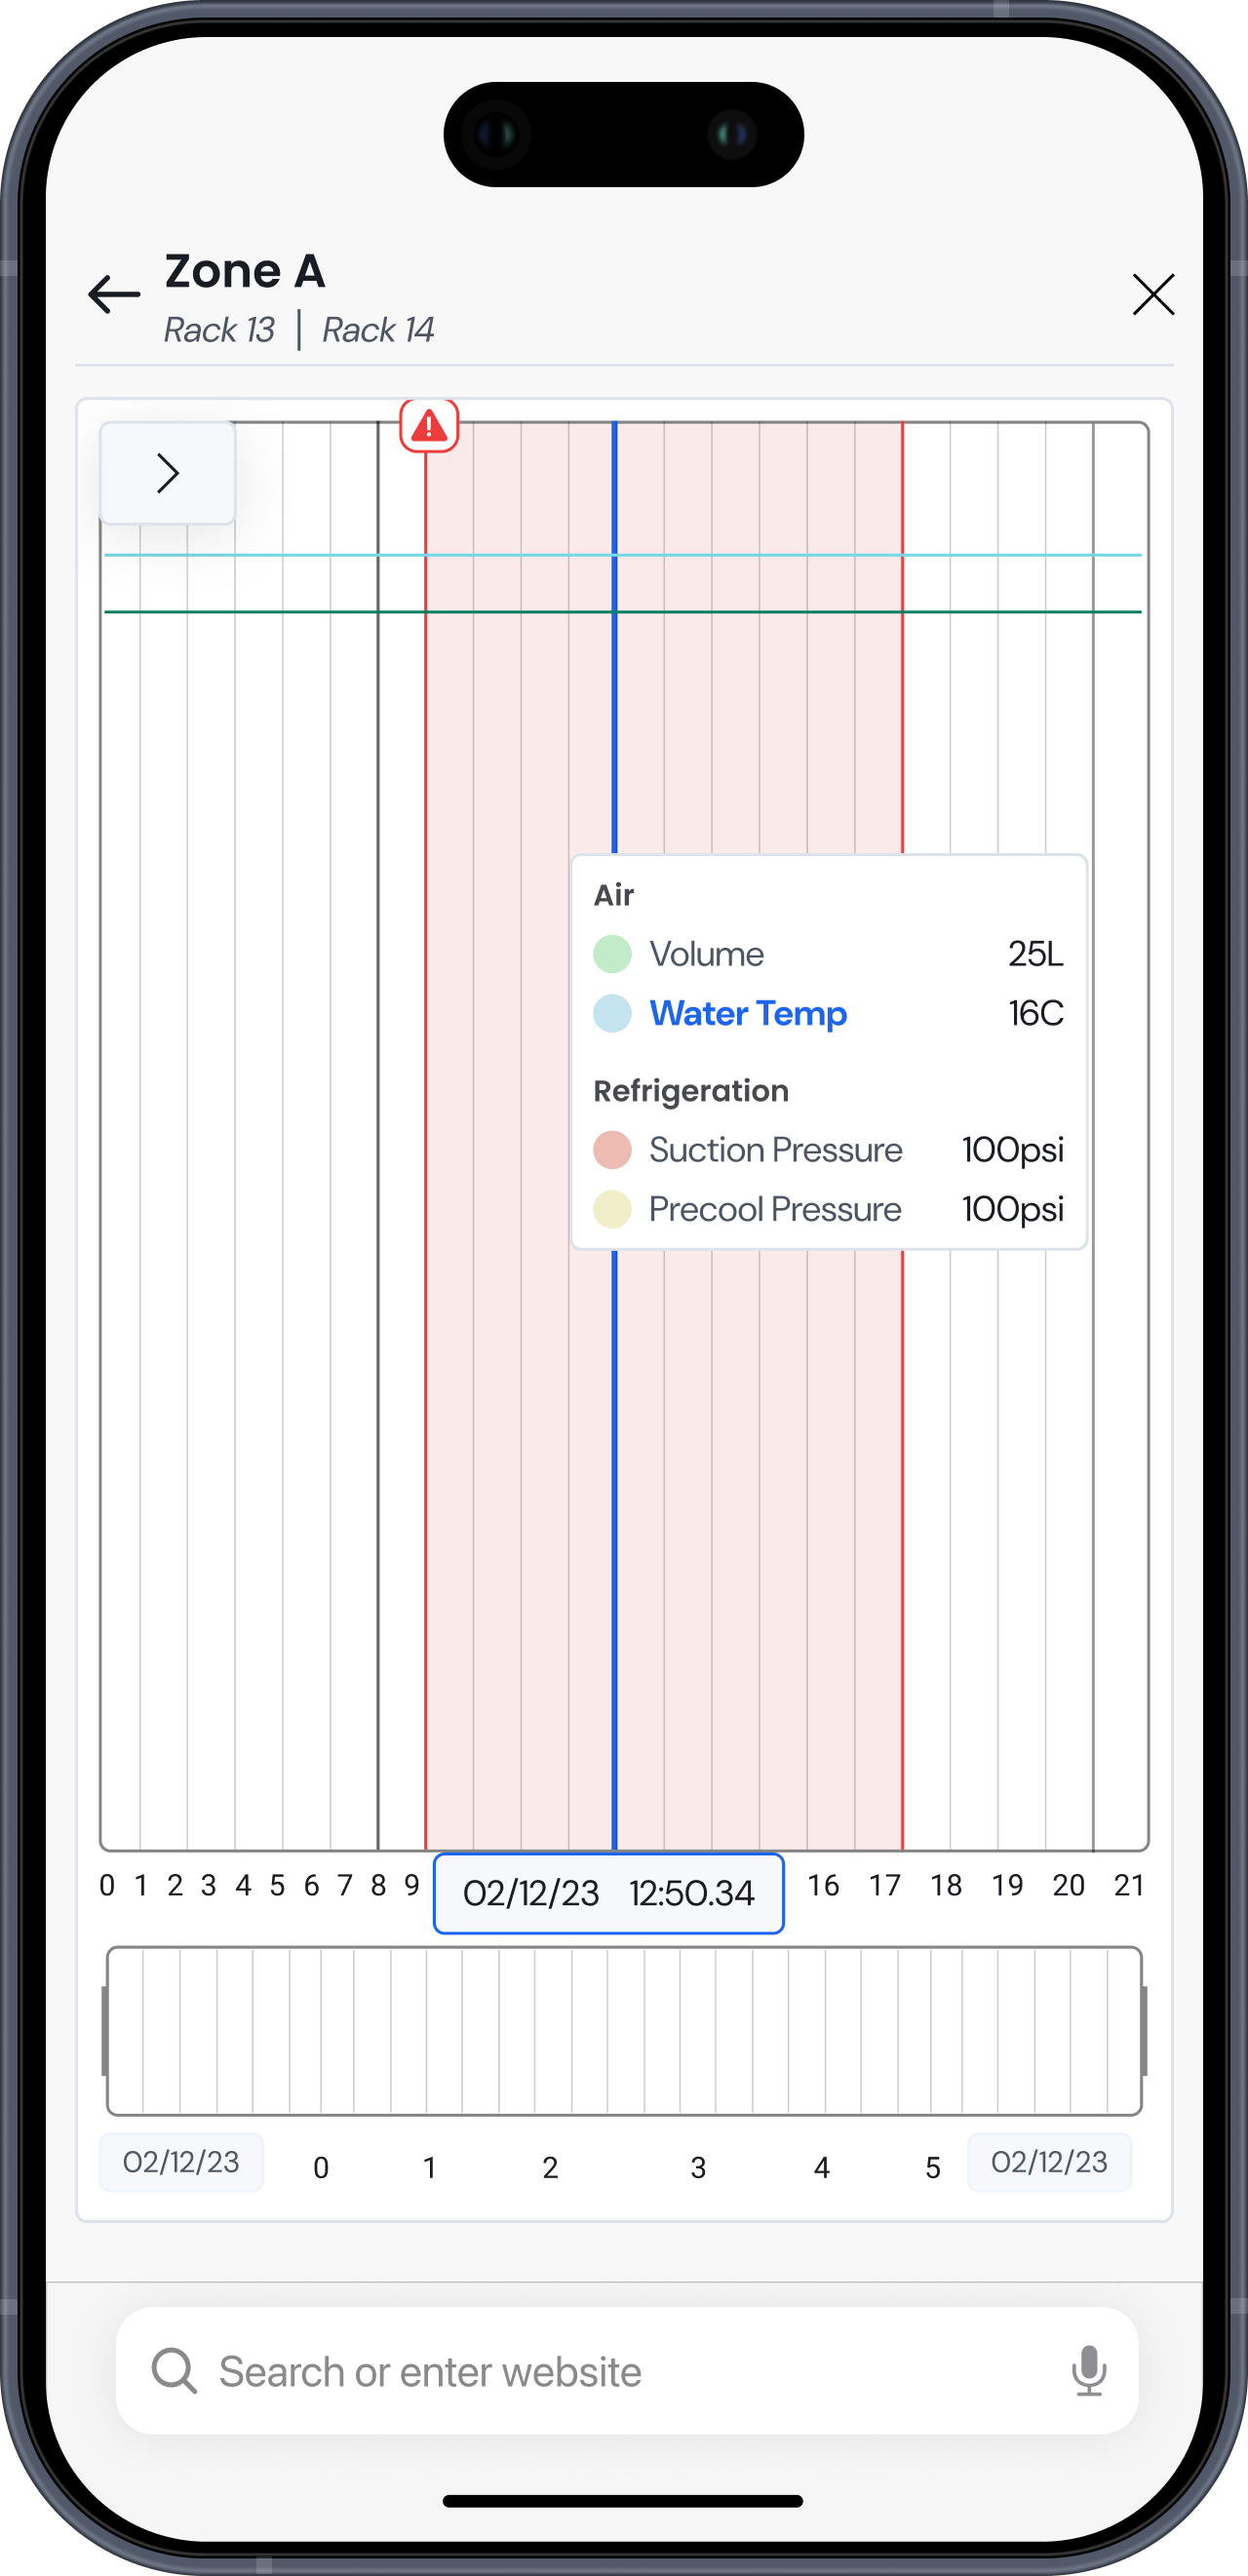
If a recorded issue occurred within the viewed range, the graph will appear red as shown with a warning symbol at the start point.
Hovering over the graph will bring up the tool tip pop up. This displays all active variables and will snap to line closest to the cursor.
The data can be activated or deactivated in the legend. Individual variables or full groups can be toggled with a click.
Activating live mode will snap the display to the right and lock the frame to the current time.
Results
How did users respond to using the tool?
Zones are left open and forgotten
A few times during testing the racks were left apart and forgotten about overnight. This resulted in poor plant lightings and was a key pain point we identified.
Understanding issue alerts
Issues were hidden behind a clickable link that just showed the number of issues. Many users reported not really checking the issues for their severity, thinking it might be a common issue
Many users also missed important issues resulting in catastrophic crop failures. Multiple requests for text notifications were received during initial testing.
There was a lot of confusion around pause mode, specifically, what features were actually paused. The timer counting down also led users to believe something was broken.
Improvements
What did we change
Switch from pause to Observation mode
Observation mode, formerly known as “pause mode” was also changed to being indefinite. The timers count up and change colour to indicate severity if the mode lasts beyond an hour.
More visible timers
Timers were changed to being indefinite and shown as counting up. The chips appearing on the left make them more noticeable to prevent farmers from forgetting them.
Active tasks
Active tasks will now appear on the left side of the cell in a clickable pill. The pill contains a timer counting up if relevant to the task.
Open Blades
If blades are left open, a chip is shown to remind farmers. If left for too long, it will progress into an issue and eventually a notification.
Status Bar
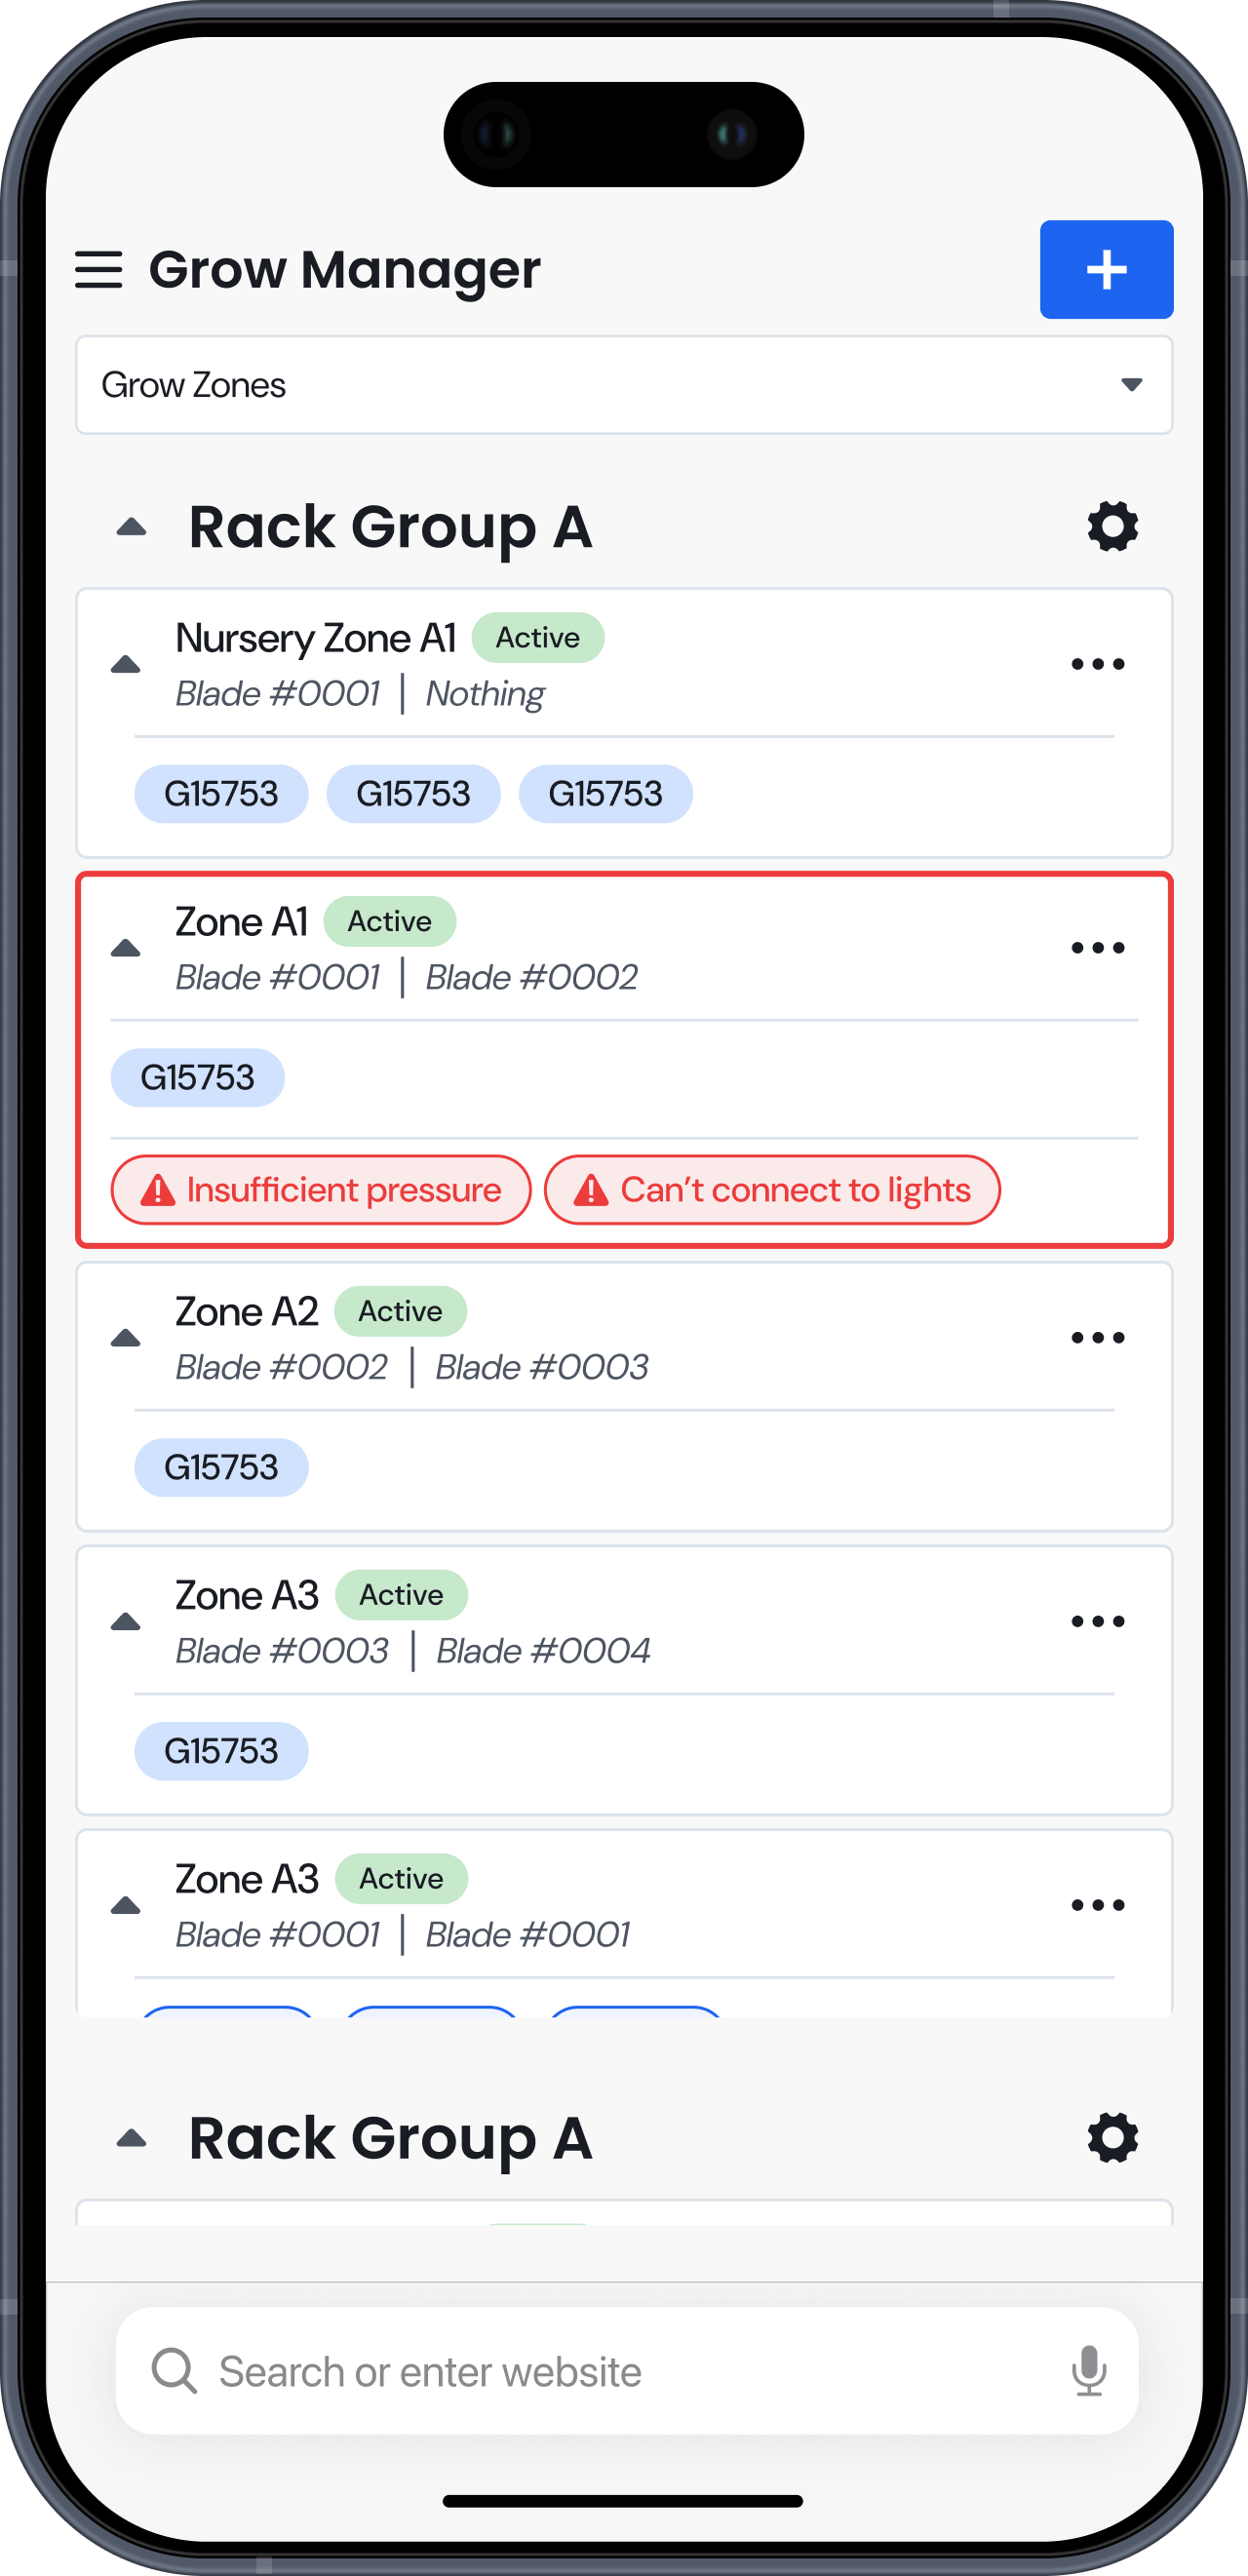
All issues now appear in pills below the cell in the “status bar”. This section contains all active status info and only appears if relevant.
Extra context in issue messages
Issues now show below the blade cell to give more space. The issue pills contain more info related to the issue.
Pausing individual widgets
Resuming from observation mode was rarely used in practice. So we moved the resume buttons down into the individual widgets.
Responsiveness
How do I access these features on smaller devices
Results
How did users respond to using the tool?

15
Unique issues located in the first month
Locating new issues
With the improved analytics & events tabs, we were able to identify and address previously unknown performance issues. Users spent far more time observing their farm in off hours identifying issues easily missed during our testing.

15
Unique issues located in the first month
Reduced down time
Issues in the farms were now identified quicker and far more accurately resulting in far less downtime. The failure rate of crops also fell dramatically as critical errors were easily identified as soon as they happened.
Feedback:
The farm went down last week and I had alerts turned off can I still check what happened?
Our design plans
Historic event logs
We plan to add a log of all farm activity within a zone. This list will early identify issues within the zone along with an accosted severity level from 1-5 denoted by the cell's colour.
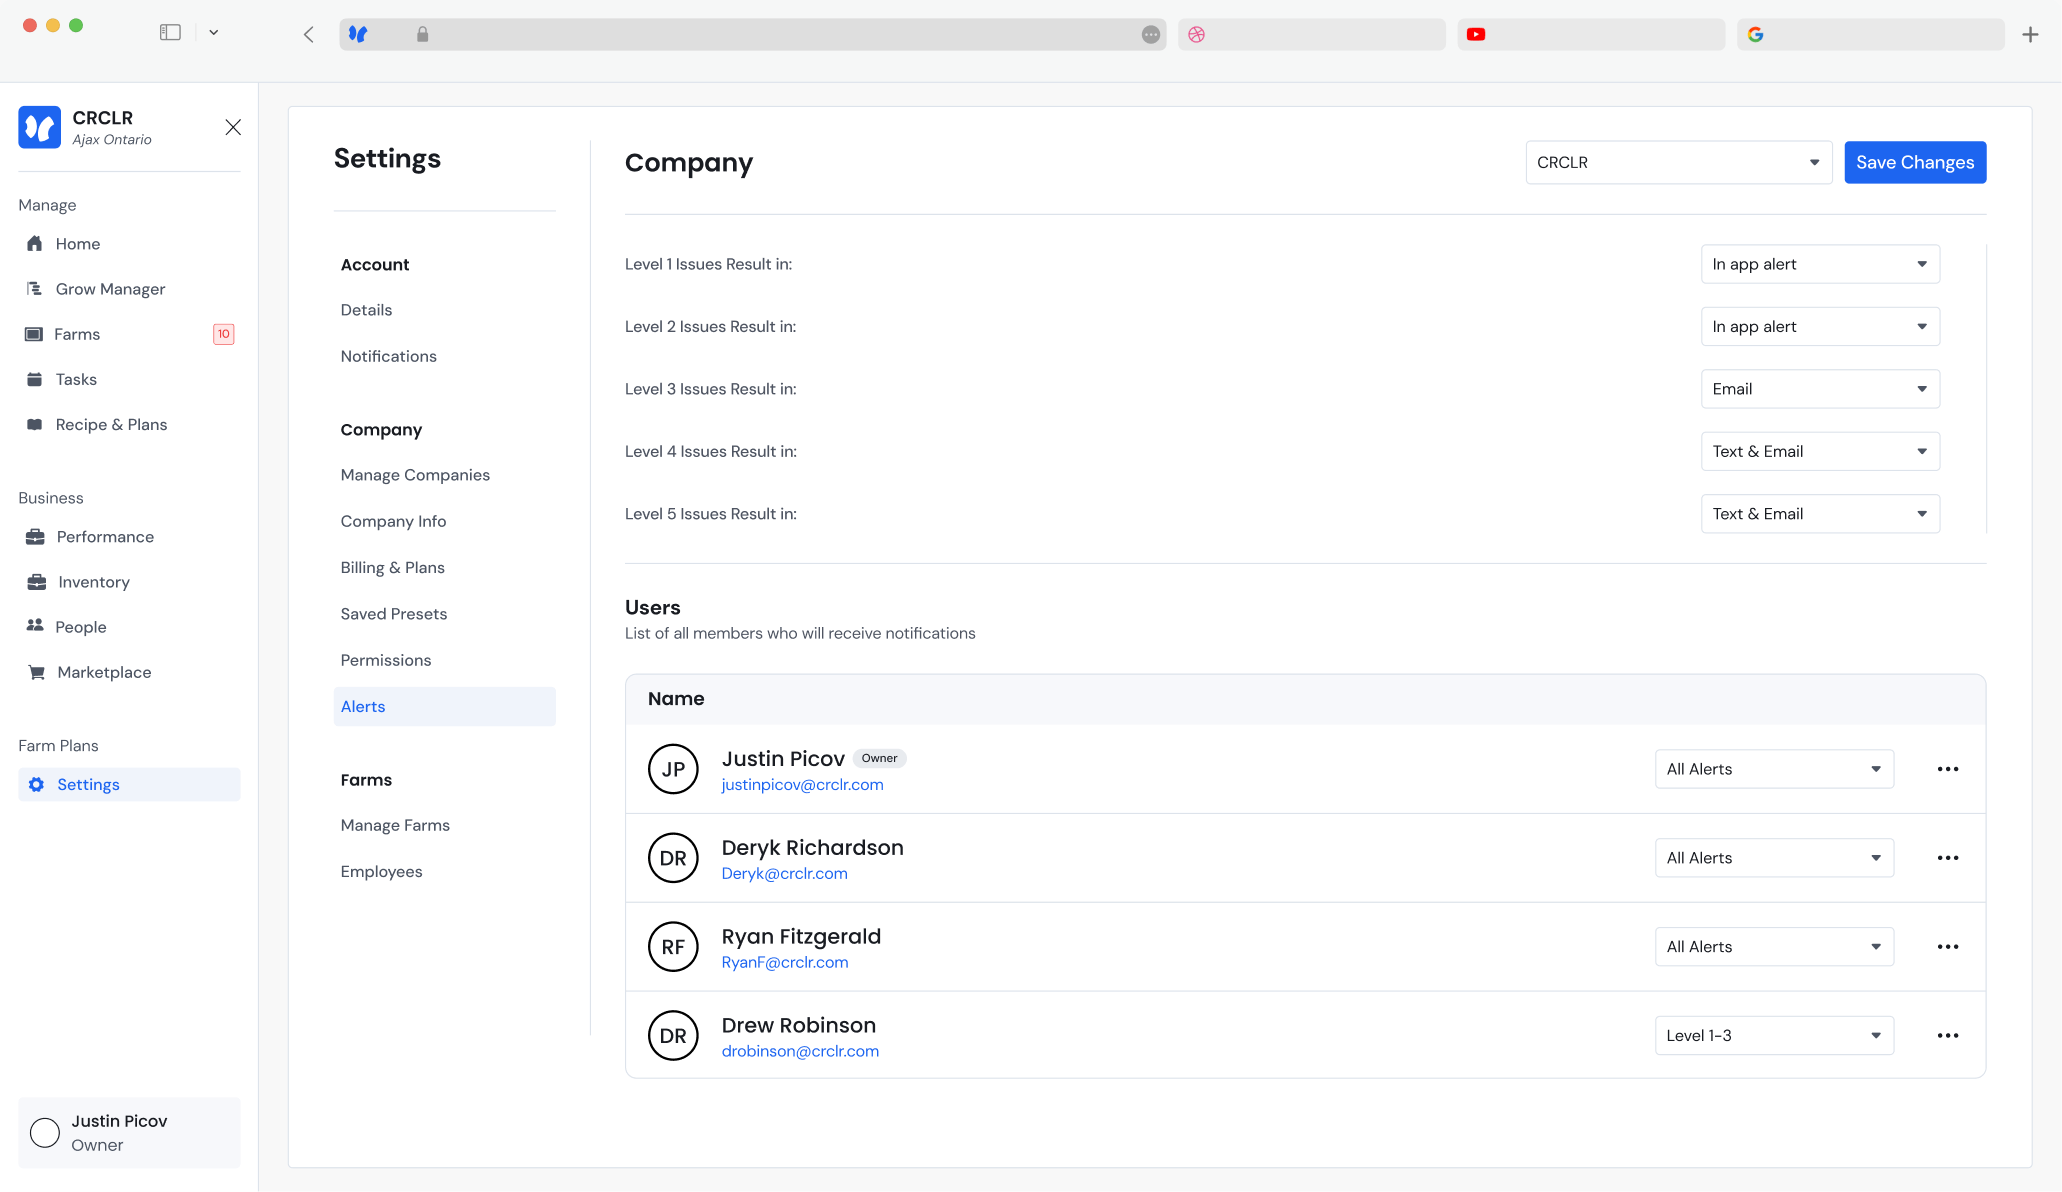
Feedback:
I’d love to be able to disable some of the alerts. I don’t personally care about air temp
Our design plans
Notification management
We plan to eventually assign all issues a severity level from 1 to 5. Users will be able to configure the response to thesis issues to result in actions ranging form inappropriate notifications to immediate text messages.